. 2019 Apr 1;218(4):1108-1117.
doi: 10.1083/jcb.201808015. Epub 2019 Jan 23.

MAD1-dependent recruitment of CDK1-CCNB1 to kinetochores promotes spindle checkpoint signaling

Affiliations

MAD1-dependent recruitment of CDK1-CCNB1 to kinetochores promotes spindle checkpoint signaling

Tatiana Alfonso-Pérez et al. J Cell Biol. .

Abstract

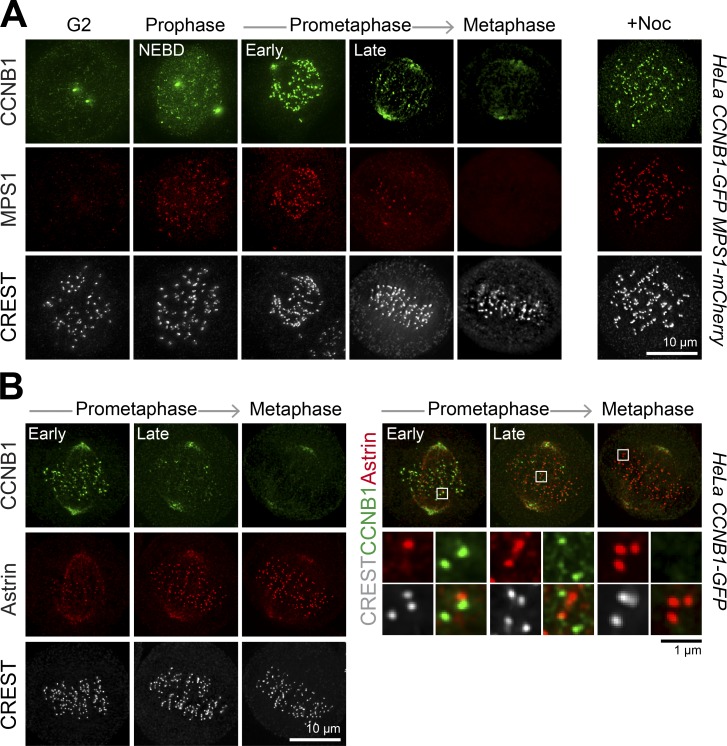
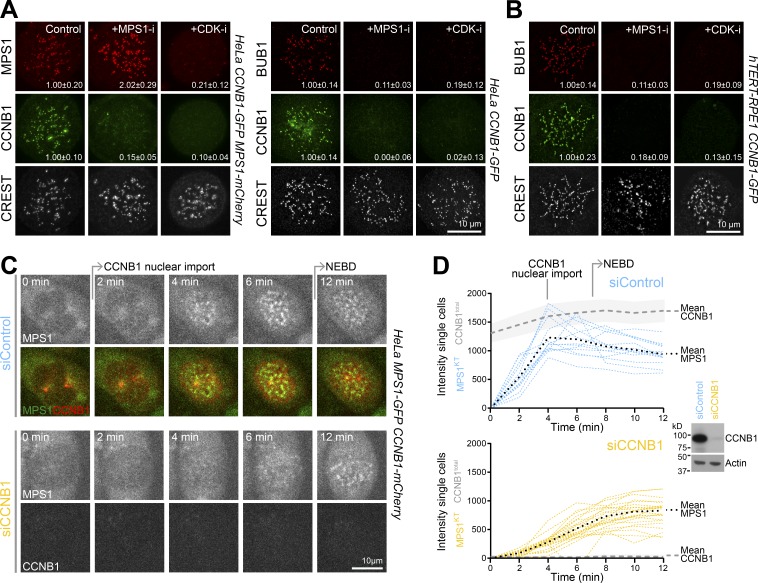
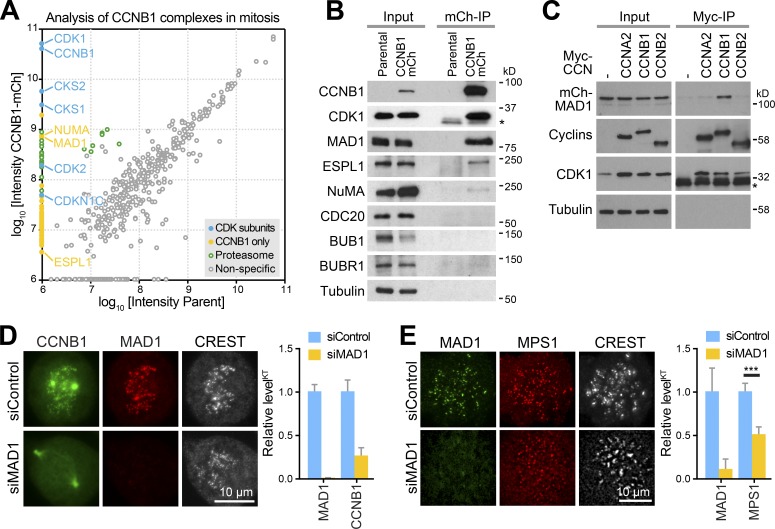
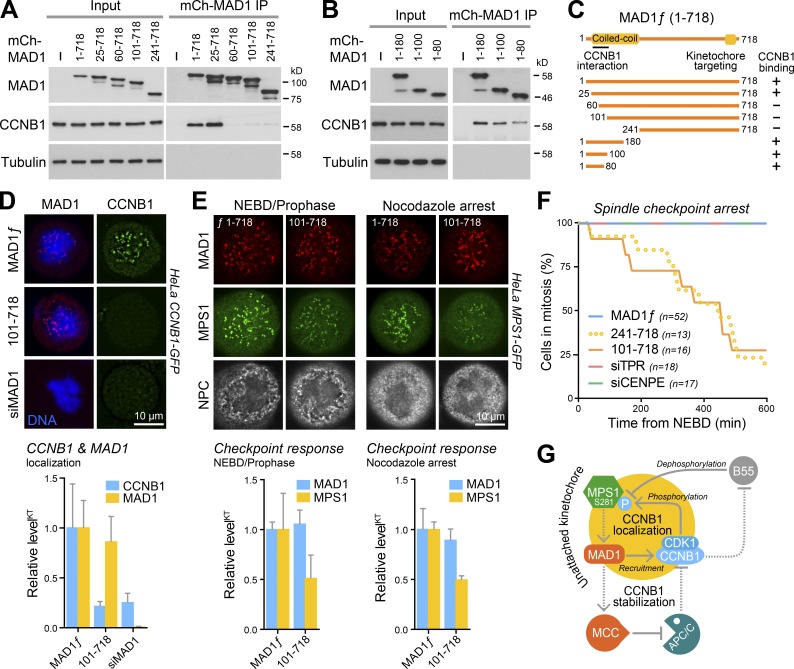
Cyclin B-dependent kinase (CDK1-CCNB1) promotes entry into mitosis. Additionally, it inhibits mitotic exit by activating the spindle checkpoint. This latter role is mediated through phosphorylation of the checkpoint kinase MPS1 and other spindle checkpoint proteins. We find that CDK1-CCNB1 localizes to unattached kinetochores and like MPS1 is lost from these structures upon microtubule attachment. This suggests that CDK1-CCNB1 is an integral component and not only an upstream regulator of the spindle checkpoint pathway. Complementary proteomic and cell biological analysis demonstrate that the spindle checkpoint protein MAD1 is one of the major components of CCNB1 complexes, and that CCNB1 is recruited to unattached kinetochores in an MPS1-dependent fashion through interaction with the first 100 amino acids of MAD1. This MPS1 and MAD1-dependent pool of CDK1-CCNB1 creates a positive feedback loop necessary for timely recruitment of MPS1 to kinetochores during mitotic entry and for sustained spindle checkpoint arrest. CDK1-CCNB1 is therefore an integral component of the spindle checkpoint, ensuring the fidelity of mitosis.


Figures

Figure 1.
Figure 1.
MPS1 and CCNB1 localize to unattached kinetochores. (A) HeLa CCNB1-GFP/MPS1-mCherry cells were stained with CREST serum to label kinetochores. Representative images of cells at different phases of mitosis and after 5-min treatment with 3 µM nocodazole (right) are shown. (B) HeLa CCNB1-GFP cells at the different stages of mitosis were stained with antibodies for Astrin and kinetochores (CREST).
Figure 2.
Figure 2.
MPS1 and CDK regulate CCNB1 kinetochore localization. (A and B) HeLa CCNB1-GFP/MPS1-mCherry (A, left), HeLa CCNB1-GFP (A, right), or hTERT1-RPE1 CCNB1-GFP (B) cells were arrested in mitosis with 0.3 µM nocodazole for 4 h and then treated with 2 µM AZ3146 (+MPS1-i) or 5 µM flavopiridol (+CDK-i) for 10 min. Kinetochores were stained for CREST and BUB1. The numbers inset in the image panels indicate the mean kinetochore signal ± SEM of MPS1, BUB1, and CCNB1 relative to the control (15 kinetochores per cell and 12 cells in each of three independent experiments). (C) Control (siControl) or CCNB1 (siCCNB1) depleted HeLa MPS1-GFP/CCNB1-mCherry cells were imaged every 2 min. Representative images of cells from the point at which cell rounding was first observed, set to 0 min, are shown. (D) Fluorescence intensity (It) for total cellular CCNB1-mCherry (CCNB1total) and MPS1-GFP at kinetochores (MPS1KT) are plotted over time for single cells (n = 13 for siControl and 22 for siCCNB1). Mean CCNB1-mCherry signal is indicated with a gray dashed line; the light gray area marks the SEM. For MPS1-GFP, color-coded lines show the kinetochore signal from individual cells as a function of time, and the black dots mark the mean intensity. Western blot of the siControl and siCCNB1 cells confirmed depletion of CCNB1; actin was used as a loading control.
Figure 3.
Figure 3.
PP2A-B55 opposes CCNB1 recruitment to kinetochores. (A) Checkpoint signaling and CCNB1 localization were followed in control (siControl) and PP2A-B55 (siB55) depleted HeLa CCNB1-GFP cells. Cells were arrested for 2.5 h with 20 µM MG132, and then either fixed immediately (+MG132) or treated with 3 µM nocodazole for 5 min (+Noc) or with 5 µM flavopiridol for 1 min followed by addition of 3 µM nocodazole for 5 min (+CDK-i +Noc). MAD1 and kinetochores (CREST) were detected using antibodies, and CCNB1 using GFP fluorescence. (B) Mean kinetochore intensity ± SEM of CCNB1 and MAD1 in control (siCon) and B55-depleted (siB55) cells are plotted (15 kinetochores per cell for ≥5 cells in each of three independent experiments). (C) A schematic of the checkpoint response assay. (D) Control (siControl) and PP2A-B55 (siB55) depleted HeLa cells arrested in mitosis for 3 h with 100 µM monastrol were washed into fresh growth medium for 25 min to allow spindle formation. At that point, 0 min, or after a further 10 or 20 min, cells were challenged with 3 µM nocodazole for 5 min to test for the checkpoint response, fixed, and then stained for MAD1 and tubulin. (E) Graphs show the fraction of checkpoint silenced cells at different times after monastrol washout, before nocodazole addition. Bars indicate the SEM (for siControl: 0/10/20 min n = 263/293/277 and for siB55: n = 296/294/277). (F) Graphs show the fraction of checkpoint active cells with unseparated sister chromatids (for siControl: 0/10/20min n = 232/302/297 and for siB55: n = 277/257/306) and MAD1 signal at kinetochores (for siControl: 0/10/20min n = 64/48/65 and for siB55: n = 46/62/49); error bars indicate the SEM. (G) CCNB1 and MPS1 localization are shown for the 20-min time point challenged with 3 µm nocodazole (+Noc) in control (siCon) or PP2A-B55 (siB55) depleted HeLa CCNB1-GFP/MPS1-mCherry cells. MPS1 intensity is plotted relative to the cytoplasmic CCNB1 signal for individual kinetochores with the mean and SD (15 kinetochores per cell in 26 [siCon] or 27 [siB55] cells).
Figure 4.
Figure 4.
MAD1 is the kinetochore receptor for CCNB1. (A and B) CCNB1-mCherry (CCNB1-mCh) was immunoprecipitated (IP) with anti-mCherry antibodies from CCNB1-mCh or parental HeLa cells arrested in mitosis. Coprecipitating proteins were analyzed by mass spectrometry in three independent experiments (A) or by Western blotting (B). Intensities of proteins identified by mass spectrometry in all experiments were plotted against each other. Nonspecific components of the IPs are found equally in both samples and therefore align along the diagonal. Specific components of CCNB1 complexes cluster along the y-axis of the plot. (C) Cyclin IPs were performed from HEK293T cells cotransfected with full-length mCh-MAD1 and Myc-CCNA2, CCNB1 or CCNB2 constructs indicated. Myc IPs were Western blotted for Myc to detect precipitated cyclins, for CDK1, and for mCh to detect coprecipitated MAD1. Asterisks mark the antibody light chain detected in the CDK1 blots for IP samples. (D) Prometaphase localization of CCNB1 in control (siControl) and MAD1 (siMAD1) depleted HeLa CCNB1-GFP cells arrested with 20 µM MG132 for 30 min, then stained for MAD1 and kinetochores (CREST). Kinetochore fluorescence of MAD1 and CCNB1 normalized to the respective mean signal in control cells and SEM are plotted in the bar graphs (15 kinetochores per cell and 12 cells in each of three independent experiments). (E) Prometaphase localization of MPS1 in control (siControl) and MAD1 (siMAD1) depleted HeLa MPS1-mCherry cells stained for MAD1 and kinetochores (CREST). Kinetochore fluorescence of MAD1 and MPS1 normalized to the respective mean signal in control cells and SEM are plotted in the bar graphs (n = 19, P value for MPS1-mCherry < 0.0001, Student’s t test).
Figure 5.
Figure 5.
Efficient checkpoint arrest requires the interaction of CCNB1 and MAD1. (A and B) HeLa cells were transfected with Myc-CCNB1 and either empty vector negative control (–), full-length mCh-MAD1, N-terminal (A) or C-terminal (B) MAD1 truncations. MAD1 IPs were performed using mCh-antibodies and Western blotted for CCNB1 with Myc-antibodies. (C) A schematic of the MAD1 truncations summarizes the CCNB1 binding data. (D) mCh-MAD1ƒ or MAD1101–718 were expressed in HeLa CCNB1-GFP cells depleted of endogenous MAD1 for 72 h with an siRNA duplex targeting the 3′ UTR of the MAD1 mRNA (siMAD1). Cells were then arrested in mitosis for 4 h with 0.3 µM nocodazole and 20 µM MG132. Mean kinetochore fluorescence ± SEM of MAD1 and CCNB1 normalized to the respective signal in control cells are plotted in the graph (n ≥ 12 cells per condition, 15 kinetochores per cell in three independent experiments). DNA was stained with DAPI. (E) mCh-MAD1ƒ or MAD1101–718 were expressed in HeLa MPS1-GFP cells depleted of endogenous MAD1 for 72 h with an siRNA duplex targeting the 3′ UTR of the MAD1 mRNA. Cells were then arrested in mitosis for 4 h with 0.3 µM nocodazole and 20 µM MG132 and stained for nuclear pore complexes (NPC). Graphs show the mean MAD1 or MPS1 levels ± SEM at unattached kinetochores (15 kinetochores per cell) in normal prophase (n = 3 cells per condition) and nocodazole-arrested mitosis (n = 12 cells per condition). (F) HeLa Flp-in/TREx GFP-MAD1ƒ, GFP-MAD1241–718, and GFP-MAD1101–718 cells were depleted of endogenous MAD1 for 72 h. Expression of GFP-MAD1 transgenes was induced for the last 48 h, and the cells were then imaged over 10 h in the presence of 0.3 µM nocodazole. The proportion of cells remaining in mitosis over a 600-min time course is plotted. HeLa cells depleted of CENP-E or TPR were checkpoint challenged and imaged in the same way. (G) MPS1 promotes recruitment of MAD1 to unattached kinetochores (shown as the yellow circle). CDK1-CCNB1 localizes to unattached kinetochores through an interaction with MAD1, creating a positive feedback loop counteracted by the action of PP2A-B55 on MPS1. MAD1 promotes formation of the APC/C inhibitor, mitotic checkpoint complex (MCC). This creates a second positive feedback loop preventing CCNB1 destruction. Solid lines indicate direct interactions (recruitment, phosphorylation, or dephosphorylation), whereas dotted lines indicate multistep processes. Components drawn outside the yellow circle are active globally rather than acting locally at the unattached kinetochore.

References

    1. Bastos R.N., and Barr F.A.. 2010. Plk1 negatively regulates Cep55 recruitment to the midbody to ensure orderly abscission. J. Cell Biol. 191:751–760. 10.1083/jcb.201008108 - DOI - PMC - PubMed
    1. Bentley A.M., Normand G., Hoyt J., and King R.W.. 2007. Distinct sequence elements of cyclin B1 promote localization to chromatin, centrosomes, and kinetochores during mitosis. Mol. Biol. Cell. 18:4847–4858. 10.1091/mbc.e06-06-0539 - DOI - PMC - PubMed
    1. Chen Q., Zhang X., Jiang Q., Clarke P.R., and Zhang C.. 2008. Cyclin B1 is localized to unattached kinetochores and contributes to efficient microtubule attachment and proper chromosome alignment during mitosis. Cell Res. 18:268–280. 10.1038/cr.2008.11 - DOI - PubMed
    1. Ciliberto A., and Hauf S.. 2017. Micromanaging checkpoint proteins. eLife. 6:e25001 10.7554/eLife.25001 - DOI - PMC - PubMed
    1. Cundell M.J., Hutter L.H., Nunes Bastos R., Poser E., Holder J., Mohammed S., Novak B., and Barr F.A.. 2016. A PP2A-B55 recognition signal controls substrate dephosphorylation kinetics during mitotic exit. J. Cell Biol. 214:539–554. 10.1083/jcb.201606033 - DOI - PMC - PubMed

Publication types

MeSH terms