. 2019 Feb 5;116(6):2364-2373.
doi: 10.1073/pnas.1817233116. Epub 2019 Jan 23.

Balancing trade-offs between biotic and abiotic stress responses through leaf age-dependent variation in stress hormone cross-talk

Affiliations

Balancing trade-offs between biotic and abiotic stress responses through leaf age-dependent variation in stress hormone cross-talk

Matthias L Berens et al. Proc Natl Acad Sci U S A. .

Abstract

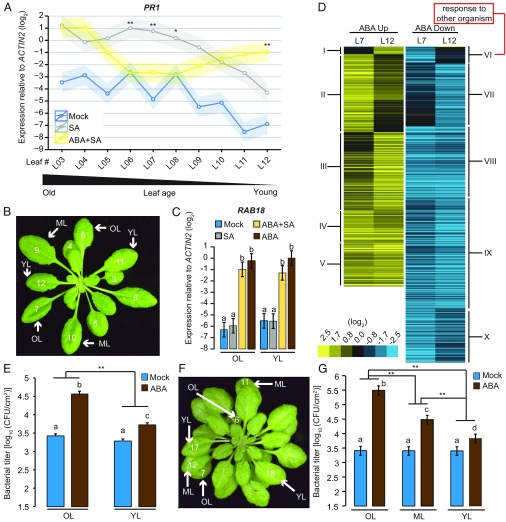
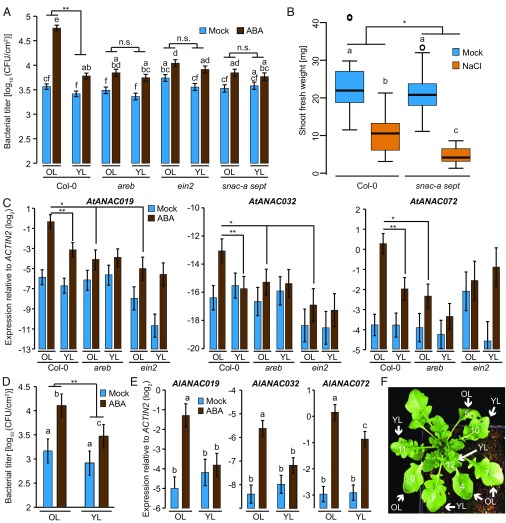
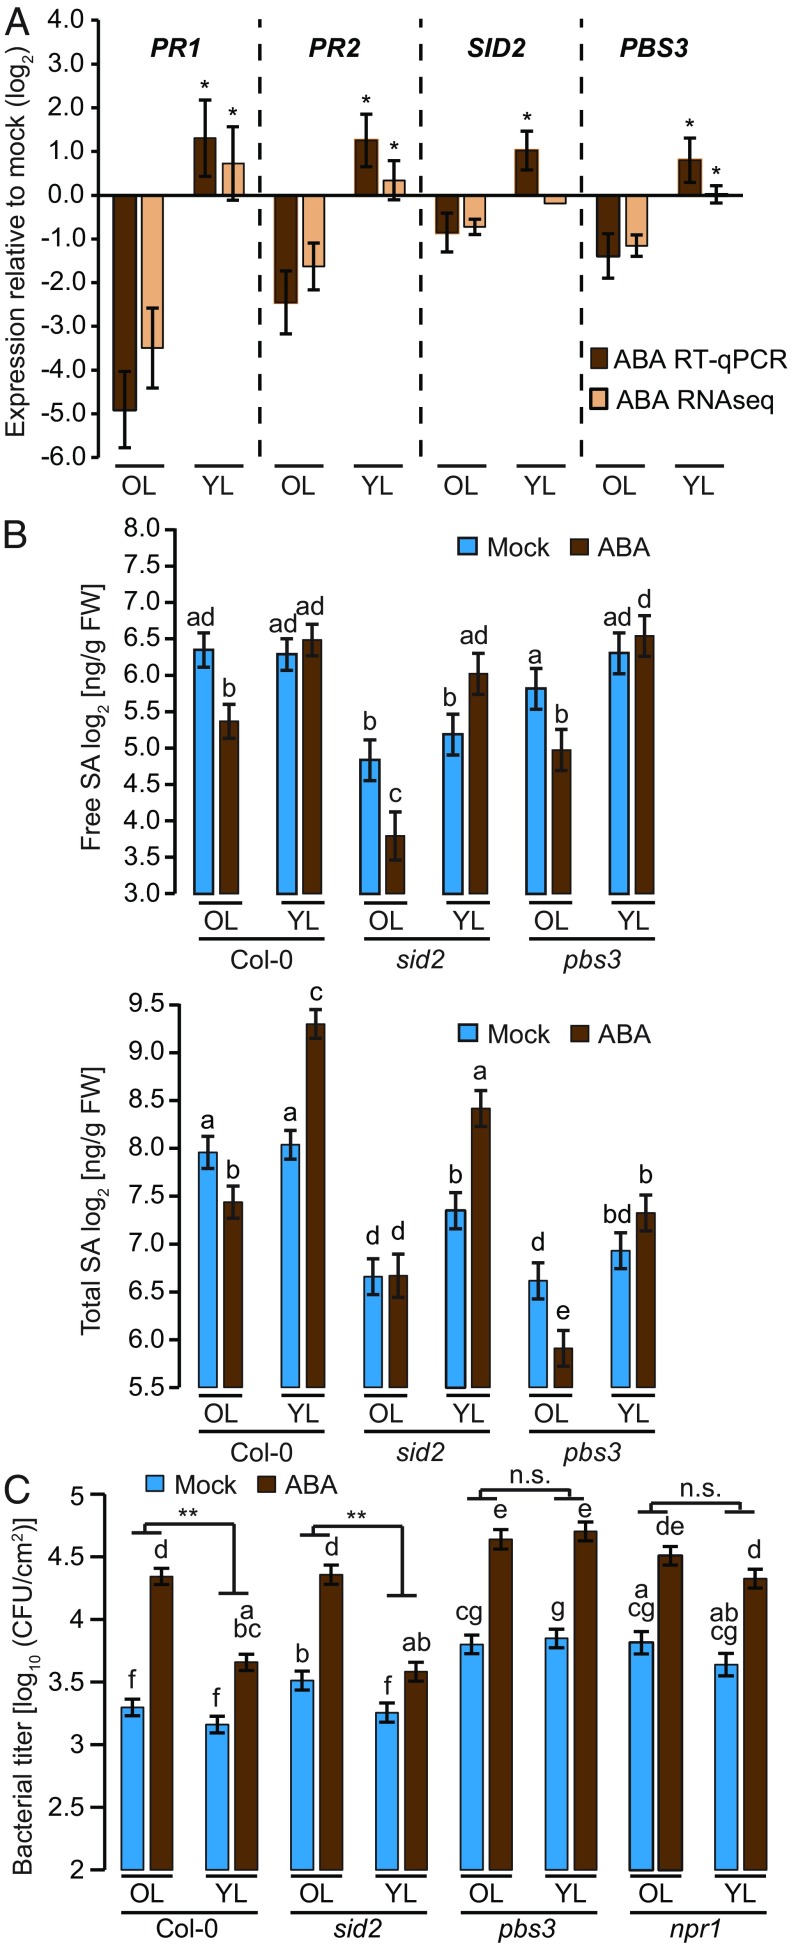
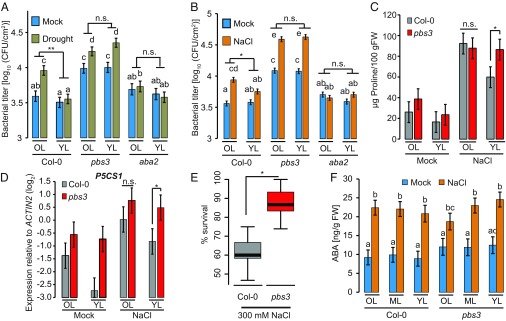
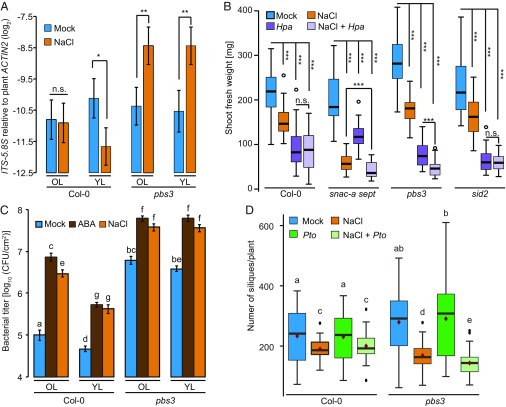
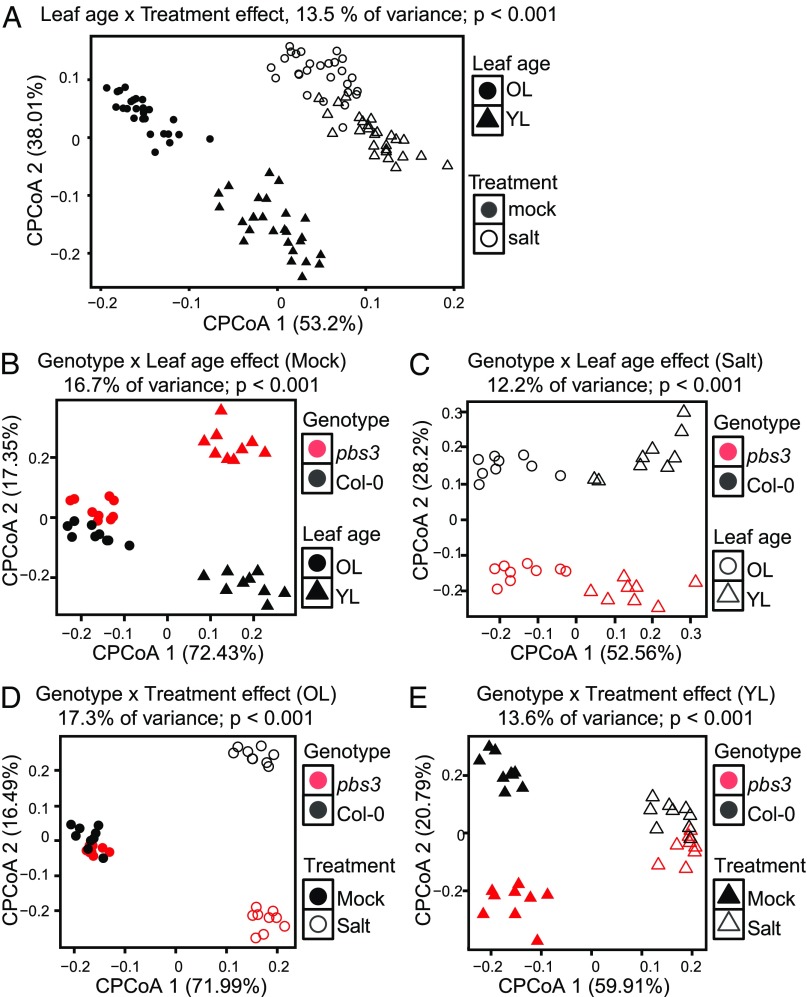
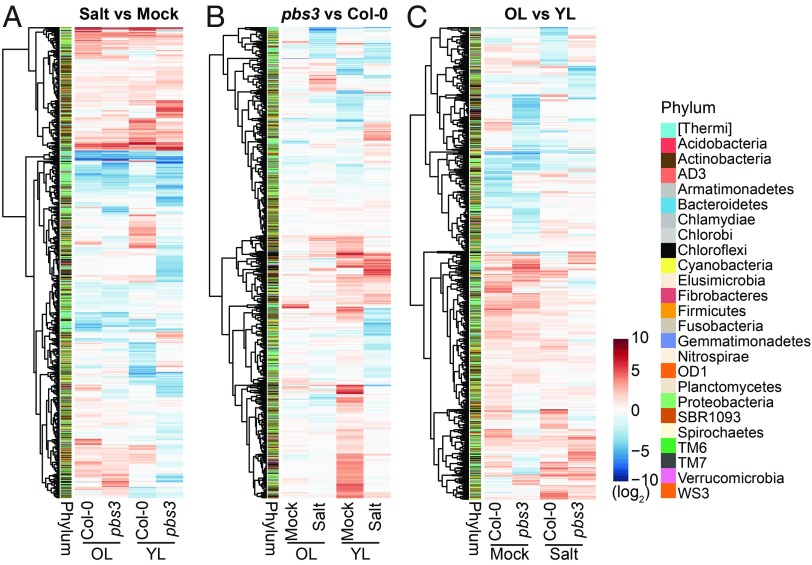
In nature, plants must respond to multiple stresses simultaneously, which likely demands cross-talk between stress-response pathways to minimize fitness costs. Here we provide genetic evidence that biotic and abiotic stress responses are differentially prioritized in Arabidopsis thaliana leaves of different ages to maintain growth and reproduction under combined biotic and abiotic stresses. Abiotic stresses, such as high salinity and drought, blunted immune responses in older rosette leaves through the phytohormone abscisic acid signaling, whereas this antagonistic effect was blocked in younger rosette leaves by PBS3, a signaling component of the defense phytohormone salicylic acid. Plants lacking PBS3 exhibited enhanced abiotic stress tolerance at the cost of decreased fitness under combined biotic and abiotic stresses. Together with this role, PBS3 is also indispensable for the establishment of salt stress- and leaf age-dependent phyllosphere bacterial communities. Collectively, our work reveals a mechanism that balances trade-offs upon conflicting stresses at the organism level and identifies a genetic intersection among plant immunity, leaf microbiota, and abiotic stress tolerance.

Keywords: combined stress; microbiota; phytohormone; plant fitness; stress trade-off.


Conflict of interest statement

The authors declare no conflict of interest.

Figures

Fig. 1.
Fig. 1.
Leaf age effects of ABA on SA response and immunity. (A) PR1 expression levels in leaves (from L03 to L12) of 4–5-wk-old A. thaliana Col-0 plants 24 h after spray with 500 µM SA, following 500 µM ABA spray pretreatment for 24 h were determined by quantitative RT-PCR. Data represent means ± SEM (shadows) calculated from three biological replicates by using a mixed linear model. Asterisks indicate significant differences between SA and combined ABA/SA treatments (*P < 0.05 and **P < 0.01, two-tailed Student’s t tests). (B and F) Leaf numbers in 4-wk-old Col-0 (B) and 35S::miR156a (F) plants highlighting old (OL), middle (ML), and young leaves (YL). (C) RAB18 expression levels in old and young leaves of 4–5-wk-old Col-0 plants as in A. Data represent means ± SEM calculated from three biological replicates by using a mixed linear model. Different letters indicate significant differences (adjusted P < 0.05). (D) Heat map showing expression patterns of the genes that show significant expression changes 48 h after ABA spray compared with mock (q < 0.01 and |log2FC| > 1) for up-regulated (yellow; 1,291 genes) or down-regulated genes (blue; 1,712 genes) in L7 or L12 of 4–5-wk-old Col-0 plants. (E and G) Pto hrcC (OD600 = 0.0002) was infiltrated into old, middle, and young leaves of 4–5-wk-old Col-0 (E) and 35S::miR156a (G) plants 24 h after 500 µM ABA spray or mock. Bacterial growth was measured at 2 days postinoculation. Data represent means ± SEM calculated from at least three independent experiments, each with at least four biological replicates, by using a mixed linear model. Different letters indicate significant differences (adjusted P < 0.005; **P < 0.01, two-tailed Student’s t tests).
Fig. 2.
Fig. 2.
ABA triggers immune suppression in old leaves through AREB and ANAC TFs. (A) Old leaves (OL) and young leaves (YL) of 4–5-wk-old Col-0, areb1 areb2 abf3 (areb), ein2, and anac septuple mutant (snac-a sept) plants were infiltrated with Pto hrcC (OD600 = 0.0002) 24 h after 500 µM ABA spray or mock. Bacterial growth was measured at 2 days postinoculation (dpi). Data represent means ± SEM calculated from three independent experiments, each with at least five biological replicates, by using a mixed linear model. Different letters indicate significant differences (adjusted P < 0.005). (B) Shoot fresh weight of Col-0 and snac-a sept seedlings grown on MS plates containing 100 mM NaCl or mock for 10 d. The box plots show combined data from three independent experiments, each with at least eight biological replicates. Different letters indicate significant differences (adjusted P < 0.05). (C) AtANAC019, AtANAC032, and AtANAC072 expression levels in old and young leaves of 4–5-wk-old Col-0 and areb1 areb2 abf3 (areb) plants 24 h after 500 µM ABA spray or mock were determined by quantitative RT-PCR. Data represent means ± SEM calculated from at least three biological replicates by using a mixed linear model. (D) Pto hrcC (OD600 = 0.0002) was infiltrated into old and young leaves of 5–6-wk-old A. lyrata plants 24 h after 500 µM ABA spray or mock. Bacterial growth was measured at 2 dpi. Data represent means ± SEM calculated from three independent experiments, each with at least five biological replicates, by using a mixed linear model. Different letters indicate significant differences (adjusted P < 0.005). (E) AlANAC019, AlANAC032, and AlANAC072 expression levels in old and young leaves of 5–6-wk-old A. lyrata plants 24 h after 500 µM ABA spray or mock were determined by quantitative RT-PCR. Data represent means ± SEM calculated from at least three biological replicates by using a mixed linear model. Different letters indicate significant differences (adjusted P < 0.05). (F) Leaf numbers in 5–6-wk-old A. lyrata showing old and young leaves. (AD) n.s., not significant (*P < 0.05 and **P < 0.01, two-tailed Student’s t tests).
Fig. 3.
Fig. 3.
PBS3 protects young leaves from ABA-triggered immune suppression. (A) The expression changes of PR1, PR2, SID2, and PBS3 in old leaves (OL) and young leaves (YL) of 4–5-wk-old Col-0 plants 48 h after 500 µM ABA spray compared with mock in RNA-seq and quantitative RT-PCR. Data represent means ± SEM of three biological replicates. Asterisks indicate significant differences in young compared with old leaves (*P < 0.05, two-tailed Student’s t tests). (B) Free and total SA amounts in old and young leaves of 4–5-wk-old Col-0, sid2, and pbs3 plants 48 h after spray with 500 µM ABA or mock. Data represent means ± SEM calculated from three biological replicates by using a mixed linear model. Different letters indicate significant differences (adjusted P < 0.05). (C) Old and young leaves of 4–5-wk-old Col-0, sid2, pbs3, and npr1 plants were infiltrated with Pto hrcC (OD600 = 0.0002) 24 h after 500 µM ABA spray or mock. Bacterial growth was measured at 2 days postinoculation. Data represent means ± SEM calculated from three independent experiments, each with at least five biological replicates, by using a mixed linear model. Different letters indicate significant differences (adjusted P < 0.005; *P < 0.05 and **P < 0.01, two-tailed Student’s t tests). n.s., not significant.
Fig. 4.
Fig. 4.
Impact of PBS3 on leaf age-dependent stress-response trade-offs. (A and B) Old leaves (OL) and young leaves (YL) of 4–5-wk-old Col-0, pbs3, and aba2 plants were infiltrated with Pto hrcC (OD600 = 0.0002) 2–3 wk after transfer to drought or well-watered conditions (mock) at 2-wk-old stage (A) or 2 d after water or 75 mM NaCl treatment (B). Bacterial growth was measured at 3 days postinoculation (dpi) (A) or 2 dpi (B). Data represent means ± SEM calculated from three independent experiments, each with at least five biological replicates, by using a mixed linear model. Different letters indicate significant differences (adjusted P < 0.01). (C and D) Proline (C) or P5CS1 expression levels (D) in old and young leaves of 4–5-wk-old Col-0 and pbs3 plants 6 d after 100 mM NaCl or mock treatment. Data represent means ± SEM calculated from three biological replicates by using a mixed linear model. (E) Survival rate of Col-0 and pbs3 plants after salinity stress recovery. Two-week-old plants were watered with 300 mM NaCl for 2 wk followed by recovery with water for another 1 wk. Data consist of three independent experiments, each with at least 35 plants per genotype. (F) The ABA levels in old, middle, and young leaves of 4–5-wk-old Col-0 and pbs3 plants 6 h after 100 mM NaCl or mock soil drench treatment. Data represent means ± SEM calculated from at least three biological replicates by using a mixed linear model. Different letters indicate significant differences (adjusted P < 0.05). (AE) *P < 0.05 and **P < 0.01, two-tailed Student’s t tests; n.s., not significant.
Fig. 5.
Fig. 5.
Leaf age-dependent variation in biotic and abiotic stress cross-talk contributes to plant fitness-related traits under combined stresses. (A) Hpa growth 8 d after inoculation in old leaves (OL) and young leaves (YL) of 4–5-wk-old Col-0 and pbs3 plants following 75 mM NaCl or water (Mock) soil drench treatment for 2 d. Data are means ± SEM calculated from at least three biological replicates by using a mixed linear model. (B) Shoot fresh weight of Col-0, snac-a sept, pbs3, and sid2 plants challenged with mock, NaCl, Hpa, or both NaCl and Hpa (Methods). The box plots show combined data from at least three independent experiments for Col-0, pbs3, and sid2 and two independent experiments for snac-a sept mutant plants, each with at least eight biological replicates. (A and B) *P < 0.05, **P < 0.01, and ***P < 0.001, two-tailed Student’s t tests; n.s., not significant. (C) Old and young leaves of 4–5-wk-old Col-0 and pbs3 plants were infiltrated with Pto cor (OD600 = 0.0002) 1 d after water, 500 µM ABA, or 100 mM NaCl treatment. Bacterial growth was measured at 2 days postinoculation. Data represent means ± SEM calculated from three independent experiments, each with at least five biological replicates, by using a mixed linear model. Different letters indicate significant differences (adjusted P < 0.005). (D) The number of siliques in Col-0 and pbs3 plants after water (Mock), 50 mM NaCl (NaCl), Pto cor (Pto), or both NaCl and Pto. The box plots show combined data from three independent experiments, each with at least 10 biological replicates. Statistical analysis was performed by using log-transformed silique numbers. Different letters indicate significant differences (adjusted P < 0.05).
Fig. 6.
Fig. 6.
PBS3 shapes the leaf age- and salt stress-dependent assembly of leaf bacterial communities. (AE) Canonical analysis of principle coordinates of bacterial β-diversity Bray–Curtis distances based on bacterial 16S rRNA profiling of leaf bacterial communities in WT Col-0, pbs3, and aba2 (A) or Col-0 and pbs3 plants (BE). Plants were grown in natural Cologne soil treated with water (mock) or 75 mM NaCl (salt) for 6 wk. Constrained analysis was performed for leaf age × treatment effect (A), genotype × leaf age effect under mock (B) or salt stress (C), and genotype × treatment effect in old leaves (OL; D) or young leaves (YL; E).
Fig. 7.
Fig. 7.
PBS3, salt stress, and leaf age determine relative bacterial abundances. (A) Heat map displaying log2 fold changes of relative abundances in bacterial OTUs under salt stress compared with mock in old leaves (OL) and young leaves (YL) of WT Col-0 and pbs3 plants. (B) Heat map displaying log2 fold changes of relative abundance for bacterial OTUs in old and young leaves of pbs3 compared with Col-0 plants under mock or salt conditions. (C) Heat map displaying log2 fold changes of relative abundance for bacterial OTUs in old leaves compared with young leaves of Col-0 and pbs3 plants under mock or salt conditions. (AC) Plants were grown in natural Cologne soil treated with water (Mock) or 75 mM NaCl (Salt) for 6 wk. The log2 fold changes were subjected to hierarchical clustering. The phylum to which each OTU belongs is indicated by the colored bar.

Similar articles

Cited by

References

    1. Pieterse CM, Leon-Reyes A, Van der Ent S, Van Wees SC. Networking by small-molecule hormones in plant immunity. Nat Chem Biol. 2009;5:308–316. - PubMed
    1. Bostock RM, Pye MF, Roubtsova TV. Predisposition in plant disease: Exploiting the nexus in abiotic and biotic stress perception and response. Annu Rev Phytopathol. 2014;52:517–549. - PubMed
    1. Wu Y, et al. Dual function of Arabidopsis ATAF1 in abiotic and biotic stress responses. Cell Res. 2009;19:1279–1290. - PubMed
    1. Berens ML, Berry HM, Mine A, Argueso CT, Tsuda K. Evolution of hormone signaling networks in plant defense. Annu Rev Phytopathol. 2017;55:401–425. - PubMed
    1. Yasuda M, et al. Antagonistic interaction between systemic acquired resistance and the abscisic acid-mediated abiotic stress response in Arabidopsis. Plant Cell. 2008;20:1678–1692. - PMC - PubMed

Publication types

Substances