. 2019 Feb 5;116(6):2243-2252.
doi: 10.1073/pnas.1813642116. Epub 2019 Jan 23.

Interrelationships between structure and function during the hemostatic response to injury

Affiliations

Interrelationships between structure and function during the hemostatic response to injury

Maurizio Tomaiuolo et al. Proc Natl Acad Sci U S A. .

Abstract

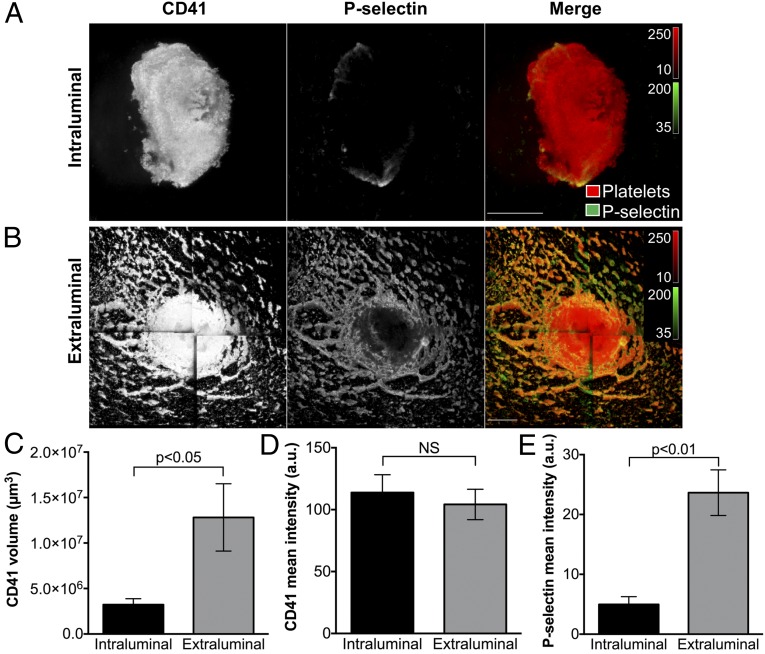
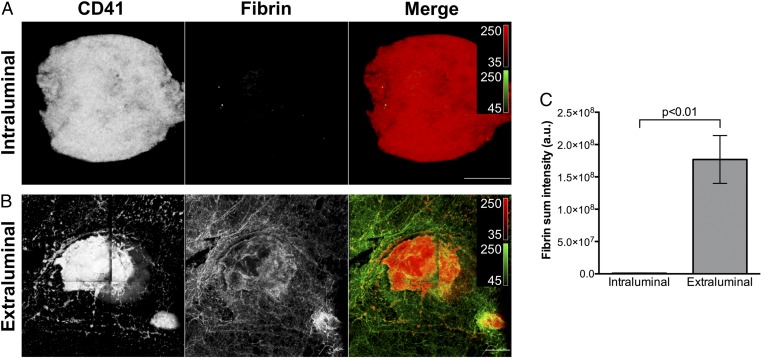
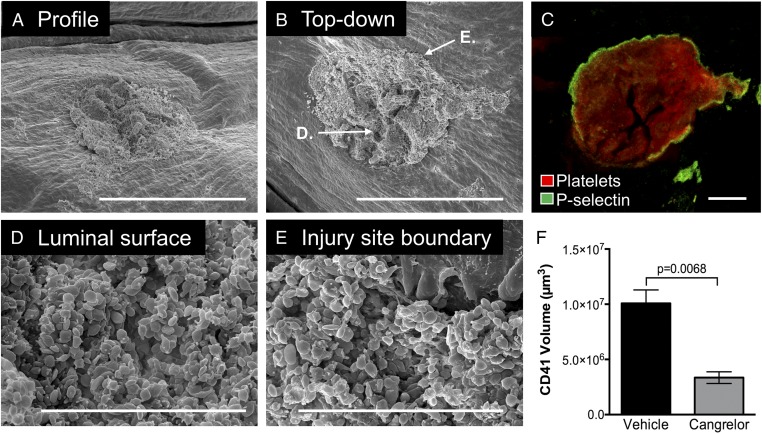
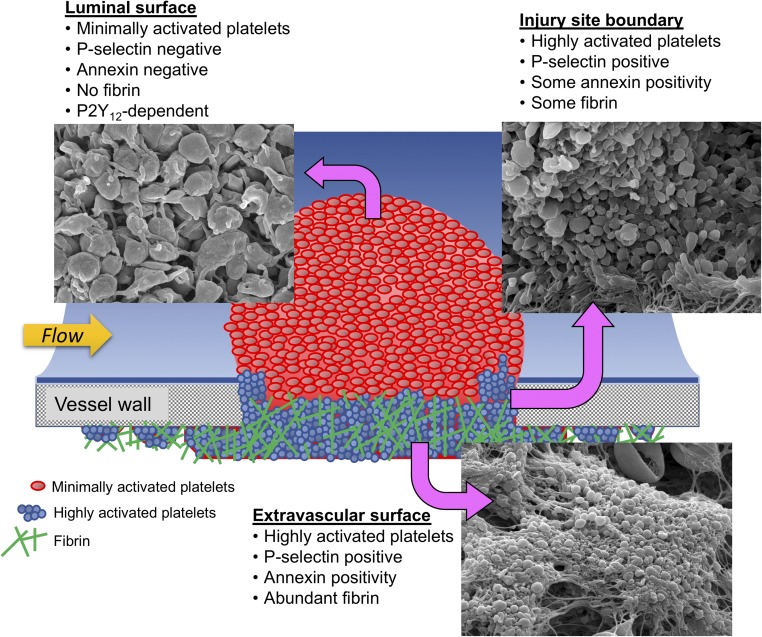
Extensive studies have detailed the molecular regulation of individual components of the hemostatic system, including platelets, coagulation factors, and regulatory proteins. Questions remain, however, about how these elements are integrated at the systems level within a rapidly changing physical environment. To answer some of these questions, we developed a puncture injury model in mouse jugular veins that combines high-resolution, multimodal imaging with functional readouts in vivo. The results reveal striking spatial regulation of platelet activation and fibrin formation that could not be inferred from studies performed ex vivo. As in the microcirculation, where previous studies have been performed, gradients of platelet activation are readily apparent, as is an asymmetrical distribution of fibrin deposition and thrombin activity. Both are oriented from the outer to the inner surface of the damaged vessel wall, with a greater extent of platelet activation and fibrin accumulation on the outside than the inside. Further, we show that the importance of P2Y12 signaling in establishing a competent hemostatic plug is related to the size of the injury, thus limiting its contribution to hemostasis to specific physiologic contexts. Taken together, these studies offer insights into the organization of hemostatic plugs, provide a detailed understanding of the adverse bleeding associated with a widely prescribed class of antiplatelet agents, and highlight differences between hemostasis and thrombosis that may suggest alternative therapeutic approaches.

Keywords: P2Y12; coagulation; hemostasis; platelets; thrombin.


Conflict of interest statement

The authors declare no conflict of interest.

Figures

Fig. 1.
Fig. 1.
Jugular vein hemostatic plug morphology: intravascular side. (A) Low-magnification SEM image of a representative hemostatic plug fixed 5 min postinjury. (Scale bar: 100 µm.) The sample is tilted to provide a profile view. Gold arrow indicates direction of blood flow. (B) The same hemostatic plug shown in A viewed from above. (Scale bar: 100 µm.) Locations of the zoomed images shown in D and E are indicated. Gold arrow indicates direction of blood flow. (C) Corresponding fluorescence image of the same hemostatic plug shown in A and B, oriented as in B. (Scale bar: 100 µm.) The image is a maximum intensity projection of a series of z-plane images acquired using 2-photon microscopy. A 3D reconstruction of the fluorescence images is included in Movie S1. (D and E) Higher magnification (Scale bar: 10 µm.) images of the regions indicated in B. White arrows (E) indicate platelets that appear to have fragmented into smaller vesicular bodies. Asterisks note intact platelets in the same field of view. Micrographs shown are representative of >10 hemostatic plugs imaged from the intravascular side 5 min postinjury. An interactive image file presenting multiple perspectives of the hemostatic plug shown is included in the SI Appendix (Dataset S1).
Fig. 2.
Fig. 2.
Jugular vein hemostatic plug morphology: extravascular side. (A) Low-magnification SEM image of a representative hemostatic plug fixed 5 min postinjury. (Scale bar: 300 µm.) The sample is tilted to provide a profile view. (B) The same hemostatic plug shown in A viewed from above. (Scale bar: 300 µm.) Location of the zoomed image shown in D is indicated. (C) Corresponding fluorescence image of the same hemostatic plug shown in A and B, oriented as in B. The image is a maximum-intensity projection of a series of z-plane images acquired using 2-photon microscopy. A 3D reconstruction of the fluorescence images is included in Movie S2. Dotted line in B and C indicates the injury site. (Scale bar: 300 μm.) (D) Higher-magnification image of the region indicated in B, showing abundant highly activated platelets interspersed with fibrin at the injury site. (Scale bar: 50 µm.) (E) Higher-magnification image of the region indicated in D showing highly activated platelets. (Scale bar: 10 µm.) Some fibrin is also seen at the lower right of the image. Asterisk notes an intact platelet in the same field of view for comparison. Micrographs shown are representative of >10 hemostatic plugs imaged from the extravascular side 5 min postinjury. An interactive image file presenting multiple perspectives of the hemostatic plug shown is included in the SI Appendix (Dataset S2).
Fig. 3.
Fig. 3.
Platelet alpha-granule secretion in the intraluminal and extravascular portions of mouse jugular vein hemostatic plugs. (A and B) Micrographs show a representative hemostatic plug fixed 5 min after puncture injury. The Top panels (A) show the intraluminal portion and Bottom panels (B) show the extraluminal portion of the same hemostatic plug imaged from each side. The images are maximum-intensity projections of a series of z-plane images acquired using 2-photon microscopy. Platelets (CD41, Left panels and red in the merge) and P-selectin expression (Middle panels, green in the merge) are shown. (Scale bars: 100 µm.) (C) The platelet volume in the intraluminal and extraluminal portions was calculated from the CD41 fluorescence. (D) CD41 fluorescence intensity (mean fluorescence intensity per pixel) in the intraluminal and extraluminal portions of hemostatic plugs. (E) P-selectin fluorescence intensity (mean fluorescence intensity per pixel) in the intraluminal and extraluminal portions of hemostatic plugs. CD41 and P-selectin quantification was performed on n = 5 hemostatic plugs as described in the SI Appendix, Supplemental Methods. Graphs show mean ± SEM; statistics were performed using a Student’s t test. NS indicates not significant.
Fig. 4.
Fig. 4.
Fibrin formation in the intraluminal and extravascular portions of mouse jugular vein hemostatic plugs. (A and B) Micrographs show a representative hemostatic plug fixed 5 min after puncture injury. The Top panels (A) show the intraluminal portion and Bottom panels (B) show the extraluminal portion of the same hemostatic plug imaged from each side. The images are maximum-intensity projections of a series of z-plane images acquired using 2-photon microscopy. Platelets (CD41, Left panels and red in the merge) and fibrin formation (Middle panels, green in the merge) are shown. (Scale bars: 100 µm.) (C) Fibrin sum fluorescence intensity in the intraluminal and extraluminal portions of hemostatic plugs. Fibrin quantification was performed on n = 6 hemostatic plugs as described in the SI Appendix, Supplemental Methods. Graphs show mean ± SEM; statistics were performed using a Student’s t test.
Fig. 5.
Fig. 5.
The impact of P2Y12 inhibition on intravascular hemostatic plug formation. Micrographs show a representative hemostatic plug from a cangrelor-treated mouse fixed 5 min postinjury. (A) Low-magnification SEM image of the intravascular portion of the hemostatic plug. (Scale bar: 300 µm.) The sample is tilted to provide a profile view. Note that the plug does not protrude into the vessel lumen substantially (compare with Fig. 1A). (B) The same hemostatic plug shown in A viewed from above. (Scale bar: 300 µm.) Locations of the zoomed images shown in D and E are indicated. (C) Fluorescence image of the same plug shown in A and B. The image is a maximum-intensity projection of a series of z-plane images acquired using 2-photon microscopy. (Scale bar: 100 µm.) (D and E) Higher-magnification SEM images of the regions of the hemostatic plug indicated in B. (F) Volume measurements of hemostatic plugs from vehicle- and cangrelor-treated mice. n = 5 vehicle- and 3 cangrelor-treated mice. Statistics were performed using a Student’s t test.
Fig. 6.
Fig. 6.
The effect of P2Y12 inhibition on extravascular hemostatic plug formation. The photomicrographs show a representative hemostatic plug from a vehicle- (AC) or cangrelor-treated (DF) mouse fixed 5 min postinjury. (A and D) Low-magnification SEM images of the extravascular portion of the hemostatic plug. (Scale bar: 300 µm.) Note that the hole in the vessel wall did not completely seal within the 5-min observation period in the cangrelor-treated mouse (the bright region in the center of the image in D is the open hole). (B and E) Higher-magnification SEM image of a region at the periphery of the hemostatic plug, as indicated by the arrows in A and D. (Scale bar: 10 µm.) Note the presence of highly activated platelets (white arrows) and regions of fibrin and red blood cells (arrowheads) in both vehicle- and cangrelor-treated mice. (C and F) Higher-magnification SEM images of a region of the hemostatic plug close to the injury site, as indicated by the arrows in A and D. (Scale bar: 10 µm.) Note that platelets in this region appear highly activated in the vehicle-treated (C) and minimally activated in the cangrelor-treated mouse (F).
Fig. 7.
Fig. 7.
The importance of P2Y12 signaling for hemostasis increases with injury size. The photomicrographs show the intravascular portion of representative hemostatic plugs from vehicle- and cangrelor-treated mice fixed 5 min postinjury. (A) 125-µm-diameter needle; (B) 300-µm-diameter needle; and (C) 600-µm-diameter needle. In all cases, plugs from vehicle-treated mice are shown in the top row and cangrelor-treated mice in the second row. The intact endothelium lining the vessel is pseudocolored light blue to provide contrast. (Scale bar in all images: 100 µm.) The samples have been tilted to provide a profile view of the hemostatic plugs. Kaplan-Meier plots in the bottom row show percentage of mice bleeding versus time for vehicle- and cangrelor-treated mice subjected to puncture injuries with the indicated needle sizes (31). Experiments were terminated at 5 min postinjury (300 s). For 125 µm injury, vehicle (n = 15) and cangrelor (n = 12); 300 µm injury vehicle (n = 18) and cangrelor (n = 19); and 600 µm injury vehicle (n = 12) and cangrelor (n = 8). Statistics were performed using a log rank (Mantel-Cox) test.
Fig. 8.
Fig. 8.
Spatial heterogeneity of platelet activation and fibrin formation. An illustrated summary of the morphologic and molecular features of platelets and fibrin in different spatial domains of hemostatic plugs formed after puncture injury of mouse jugular veins. (Magnification: 5,000×.)

Similar articles

Cited by

References

    1. Stalker TJ, et al. A systems approach to hemostasis: 3. Thrombus consolidation regulates intrathrombus solute transport and local thrombin activity. Blood. 2014;124:1824–1831. - PMC - PubMed
    1. Silvain J, et al. Thrombus composition in sudden cardiac death from acute myocardial infarction. Resuscitation. 2017;113:108–114. - PubMed
    1. Silvain J, et al. Composition of coronary thrombus in acute myocardial infarction. J Am Coll Cardiol. 2011;57:1359–1367. - PMC - PubMed
    1. Sevitt S. The structure and growth of valve-pocket thrombi in femoral veins. J Clin Pathol. 1974;27:517–528. - PMC - PubMed
    1. Tomaiuolo M, et al. A systems approach to hemostasis: 2. Computational analysis of molecular transport in the thrombus microenvironment. Blood. 2014;124:1816–1823. - PMC - PubMed

Publication types