. 2019 Feb;31(2):399-416.
doi: 10.1105/tpc.18.00675. Epub 2019 Jan 23.

Interaction and Regulation Between Lipid Mediator Phosphatidic Acid and Circadian Clock Regulators

Affiliations

Interaction and Regulation Between Lipid Mediator Phosphatidic Acid and Circadian Clock Regulators

Sang-Chul Kim et al. Plant Cell. 2019 Feb.

Abstract

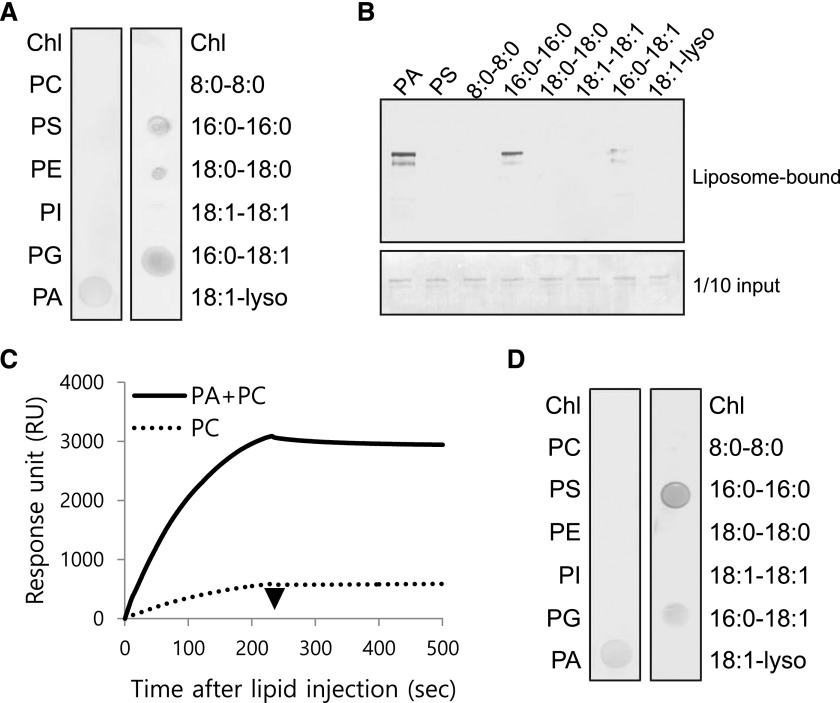
Circadian clocks play important roles in regulating cellular metabolism, but the reciprocal effect that metabolism has on the clock is largely unknown in plants. Here, we show that the central glycerolipid metabolite and lipid mediator phosphatidic acid (PA) interacts with and modulates the function of the core clock regulators LATE ELONGATED HYPOCOTYL (LHY) and CIRCADIAN CLOCK ASSOCIATED1 (CCA1) in Arabidopsis (Arabidopsis thaliana). PA reduced the ability of LHY and CCA1 to bind the promoter of their target gene TIMING OF CAB EXPRESSION1 Increased PA accumulation and inhibition of PA-producing enzymes had opposite effects on circadian clock outputs. Diurnal change in levels of several membrane phospholipid species, including PA, observed in wild type was lost in the LHY and CCA1 double knockout mutant. Storage lipid accumulation was also affected in the clock mutants. These results indicate that the interaction of PA with the clock regulator may function as a cellular conduit to integrate the circadian clock with lipid metabolism.


Figures

Figure 1.
Figure 1.
Screening of the Library for PA Binding Transcription Factors. (A) PCR amplification of the cDNA library. PCR was performed with total plasmid DNA from the pooled E. coli colonies as a template and primers binding to upstream and downstream of the cloning sites. PCR products were separated on an agarose gel and visualized by ethidium bromide. Size of the DNA markers is indicated on the left. The experiment was performed at least twice with similar results. (B) Immunoblotting of the protein expression library. Total proteins from the pooled E. coli colonies were separated on a polyacrylamide gel and immunoblotting was performed with an anti-6xHis antibody conjugated with alkaline phosphatase. Size of the protein markers is indicated on the left. The experiment was performed at least twice with similar results. (C) Identification of LHY by mass spectrometry. Amino acid sequence of LHY is shown with the peptides underlined that have been sequenced by mass spectrometry (probability > 95% and MASCOT ion score > 40).
Figure 2.
Figure 2.
PA and LHY Binding Specificity and Kinetics. (A) Filter-blotting assays. Nitrocellulose filters spotted with the indicated lipids were incubated with LHY and blotted with an anti-6xHis antibody. Proteins were detected by alkaline phosphatase reaction. Left blot shows total molecular species of phospholipid classes from egg yolk, and right blot indicates PA species with acyl chains at sn-1 and sn-2 positions. The experiment was performed at least twice with similar results. Chl, chloroform control. PC, phosphatidylcholine; PS, phosphatidylserine; PE, phosphatidylethanolamine; PI, phosphatidylinositol; PG, phosphatidylglycerol; PA, phosphatidic acid. (B) Liposome precipitation assay. LHY was incubated with liposomes containing PC and the indicated PA species. Protein coprecipitated with the liposomes was probed by immunoblotting with anti-6xHis antibody. Bottom blot shows protein input with 1/10 of the amount used for the assay. The experiment was performed at least twice with similar results. (C) Surface plasmon resonance (SPR) analysis. Protein response was monitored as liposomes with 16:0-16:0 PC or 16:0-16:0 PA in 16:0-16:0 PC (1:3 molar ratio) liposomes were injected onto the sensor chip. Liposome injection was stopped at the time point indicated by arrow head. Values are means of triplicate. The original readout is provided in Supplemental Data Set 2. (D) PA-CCA1 interaction. Filter-blotting assays were performed as in (A) with CCA1.
Figure 3.
Figure 3.
Mass Spectrometric Confirmation of PA-LHY Binding In Vivo. (A) Isolation of LHY by immunoprecipitation. LHY was immunoprecipitated using an anti-LHY antibody from 10-d-old Arabidopsis wild-type (WT) and LHY knockout mutant (lhy) seedlings grown on 1/2 MS agar plates and harvested at ZT0, and was probed by immunoblotting using the same antibody. + and − indicate with and without antibody in the immunoprecipitation, respectively. Bottom blot shows protein input (ACTIN) with 1/10 of the amount used for the immunoprecipitation. (B) Coprecipitation of total PA with LHY. Total PA extracted from LHY immunoprecipitated in (A) was quantified by ESI-MS/MS. Values are mean ± SD (n = 3; for each bar, three independent groups of seedlings sampled at the same time were used for immunoprecipitation, lipid extraction, and MS analysis). Asterisk denotes statistical significance compared with WT, lhy+, and lhy as determined by one-way ANOVA (Duncan’s multiple range test; P < 0.001). (C) Coprecipitation of PA species with LHY. PA species from total PA extracted in (B) were quantified by ESI-MS/MS. Values are mean ± SD (n = 3 as in B). Asterisk denotes statistical significance compared with WT, lhy+, and lhy as determined by one-way ANOVA (Duncan’s multiple range test; P < 0.05).
Figure 4.
Figure 4.
Fluorescence Labeling Confirmation of PA-LHY/CCA1 Binding In Vivo. (A) Isolation of proteins by immunoprecipitation from transgenic plants. Proteins were immunoprecipitated with an anti-FLAG antibody from Arabidopsis lines expressing the FLAG-tagged proteins indicated on the top that were harvested at ZT0 and infiltrated with NBD-PA. Immunoprecipitated proteins were probed by immunoblotting with the anti-FLAG antibody. Position of each protein and size marker are on the left and right, respectively. Bottom blot shows protein input (ACTIN) with 1/10 of the amount used for the immunoprecipitation. (B) Filter-blotting assays demonstrating the PA-protein interaction. Nitrocellulose filters spotted with total PA (from egg yolk) were incubated with the indicated proteins and blotted with an anti-6xHis antibody. Proteins were detected by alkaline phosphatase reaction. The experiment was performed at least twice with similar results. (C) Coprecipitation of NBD-PA with LHY and CCA1, but not LUX. Total lipids were extracted individually from the infiltrated plants (“Total”) and from the immunoprecipitates (“IP”). Extracted lipids were separated on TLC and visualized by UV illumination. NBD-PA, authentic NBD-PA standard. The experiment was performed three times with similar results. (D) Quantification of NBD-PA from “IP” samples. NBD-PA spot density from “IP” samples shown in (C) was quantified using ImageJ software based on the known amount of NBD-PA standard. Values are mean ± SD (n = 3; for each transgenic plant, three independent groups of seedlings sampled at the same time were used for immunoprecipitation, lipid extraction, and TLC quantification). N/D, not detected.
Figure 5.
Figure 5.
PA Inhibition of LHY-DNA Interaction. (A) LHY interaction with TOC1 promoter. Electrophoretic mobility shift assay (EMSA) was performed with the proteins indicated on the top and a 48-bp oligonucleotide of TOC1 promoter region (TOC1pro-W) or the same region with LHY binding site mutated (TOC1pro-M). Black triangles indicate increasing amount (0.1, 0.2, and 0.5 mg) of proteins added. Arrows indicate positions of protein-bound (top) and free (bottom) DNA bands. The experiment was performed at least twice with similar results. GAPC1, GLYCERALDEHYDE-3-PHOSPHATE DEHYDROGENASE1. (B) PA inhibition of LHY-DNA interaction in vitro. EMSA was performed as in (A) with TOC1pro-W, 0.5 mg LHY, and the effectors indicated on the top. Black triangle indicates increasing amount (0, 0.01, 0.1, and 1 mg) of total PA (from egg yolk) added. Arrows indicate positions of protein-bound (top) and free (bottom) DNA bands. The experiment was performed at least twice with similar results. PC, phosphatidylcholine (1 mg); PG, phosphatidylglycerol (1 mg); NaH2PO4, sodium phosphate (0.1 M); HCl, hydrochloric acid (0.1 N); 18:1-18:1 and 16:0-18:1, PA molecular species (1 mg each).
Figure 6.
Figure 6.
Effect of PA on Various Clock Protein-DNA Interactions. (A) PA effect on LHY binding to ELF4pro and PRR9pro. Electrophoretic mobility shift assay (EMSA) was performed with 0.5 mg LHY, 1 mg of total PA (from egg yolk), and oligonucleotides of ELF4 and PRR9 promoter regions. Arrows indicate positions of protein-bound (top) and free (bottom) DNA bands. The experiment was performed at least twice with similar results. (B) PA effect on CCA1-DNA interaction. EMSA was performed with TOC1pro-W and 0.5 mg purified CCA1. Black triangle indicates increasing amount (0, 0.01, 0.1, and 1 mg) of total PA (from egg yolk) added. Arrows indicate positions of protein-bound (top) and free (bottom) DNA bands. The experiment was performed at least twice with similar results. (C) PA effect on LUX-DNA interaction. EMSA was performed with an oligonucleotide of LUX target sequence (LUX binding site of PRR9 promoter region), 0.5 mg purified LUX, and 1 mg total PA (from egg yolk). Arrows indicate positions of protein-bound (top) and free (bottom) DNA bands. The experiment was performed at least twice with similar results.
Figure 7.
Figure 7.
ChIP-PCR Analysis of LHY-DNA Binding in Mutants with Altered PA Production. (A) Multiple reactions in PA production and removal in plants. Enzymes catalyzing each reaction are on arrows, with the number of isotypes identified in Arabidopsis in parenthesis. DAG-PPi, diacylglycerol pyrophosphate; PIP2, phosphatidylinositol 4,5-bisphosphate; PLA, phospholipase A; LPAT, lysophosphatidic acid acyltransferase; NPC, nonspecific phospholipase C; PI-PLC, phosphatidylinositol-phospholipase C; LPP, lipid phosphate phosphatase; PAK, phosphatidic acid kinase. (B) PA levels in wild-type (WT) Arabidopsis and PLD and PAH mutants. Total lipids were extracted from 10-day-old seedlings and PA was quantified by ESI-MS/MS. Values are mean ± SD (n = 5; for each plant line, five independent groups of seedlings sampled at the same time were used for lipid extraction and MS analysis). Asterisk denotes statistical significance compared with WT as determined by Student’s t test (P < 0.01). (C) Immunoblotting of LHY protein expression. Nuclear proteins were extracted from 10-day-old Arabidopsis plants indicated at the time point used for the ChIP (ZT0). LHY was probed by an anti-LHY antibody. Histone H3 is included as a nuclear marker protein for a loading control. The experiment was performed at least twice with similar results. (D) Verification of precipitated DNA by PCR. Chromatin immunoprecipitation (ChIP) was performed using an anti-LHY antibody from 10-day-old Arabidopsis plants indicated on the top. Input DNA (ID) and DNA precipitated with antibody (+) or without antibody (−) were PCR-amplified using primers specific to the promoter region (TOC1pro) or 3′ UTR region (TOC13UTR) of TOC1. Note that the 3′ UTR region is not detected due to the DNA shearing. The experiment was performed at least twice with similar results. (E) Quantification of precipitated DNA by qPCR. ChIP was performed as in (D). DNA precipitated with the antibody was quantified by qPCR using primers specific to TOC1 promoter region. Data are shown as % of PCR product amplified from the input DNA. Values are mean ± SD (n = 5; for each plant line, five independent groups of seedlings sampled at the same time were used for IP and qPCR). Asterisk denotes statistical significance compared with WT as determined by Student’s t test (P < 0.01). N/D, not detected.
Figure 8.
Figure 8.
Perturbation of Circadian Outputs by PAH Mutations. (A) and (C) TOC1 expression under circadian condition. Plants were entrained to 12-h light/12-h dark cycles for 7 days, and TOC1 expression was analyzed under constant light by RT-qPCR. Values are mean ± SD (n = 6; for each plant line, six independent seedlings sampled at each time point indicated were used for RNA extraction and RT-qPCR analysis) normalized to the wild type (WT) at 0 h. Period length is in parenthesis. PAH-com, PAH1-complemented pah1 pah2. (B) and (D) Vertical leaf movement under circadian condition. Plants were entrained to 12-h light/12-h dark cycle for 5 days, and leaf movement was monitored under constant light. Values are mean ± SD (n = 12 for C and 8 for D; for each plant line, 12 or 8 independent seedlings photographed at each time point indicated were used for image analysis) normalized to initial leaf position. Period length is in parenthesis. PAH-com, PAH1-complemented pah1 pah2.
Figure 9.
Figure 9.
Perturbation of Circadian Outputs by Chemical Manipulation of PA. (A) and (C) Effect of 1-butanol and DGK inhibitor on circadian expression of TOC1. Transgenic plants with TOC1:LUC were entrained to 12-h light/12-dark cycles for 7 days then treated with 1% 1-butanol, 100 mM DGK inhibitor (R59022), 1% 2-butanol, or 1% DMSO at ZT12. Luciferase reporter activity was monitored under constant light. Values are mean ± SD (n > 20; for each treatment, more than 20 independent seedlings photographed at each time point indicated were used for image analysis) normalized to background signal. Period length is in parenthesis. (B) and (D) Effect of 1-butanol and DGK inhibitor on circadian leaf movement. Wild-type (WT) plants were entrained to 12-h light/12-dark cycles for 5 days then treated with 1% 1-butanol, 100 mM DGK inhibitor (R59022), 1% 2-butanol, or 1% DMSO at ZT12. Leaf movement was monitored under constant light. Values are mean ± SD (n = 12; for each treatment, 12 independent seedlings photographed at each time point indicated were used for image analysis) normalized to initial leaf position. Period length is in parenthesis. In (C) and (D), the untreated control (None) was reproduced from (A) and (B), respectively, for ease of comparison. (E) PA levels in Arabidopsis treated with butanol and DGK inhibitor. Total lipids were extracted from 7-day-old seedlings treated as in (A) and (C) for 1 h. PA was quantified by ESI-MS/MS. Values are mean ± SD (n = 5; for each treatment, five independent groups of seedlings sampled at the same time were used for lipid extraction and MS analysis). Asterisk denotes statistical significance compared with controls as determined by Student’s t test (P < 0.01).
Figure 10.
Figure 10.
Effect of LHY and CCA1 on Lipid Production. (A) to (E) Time-dependent change in levels of 36:4PG (A), 38:5PS (B), 36:6PA (C), 34:4PA (D), and total PA (E) in the wild type (WT) and lhy cca1. 10-day-old plants were grown in 16-h light/8-h dark cycles, and total lipids were extracted every 3 h for up to 24 h. Membrane glycerolipids were quantified by ESI-MS/MS. Data points (WT closed; lhy cca1 open) are mean ± SD (n = 5; for each plant line, five independent groups of seedlings sampled at each time point indicated were used for lipid extraction and MS analysis), through which the best-fit lines (WT solid; lhy cca1 dashed) are shown with the coefficient of determination (R2) for WT resulted from the polynomial regression analysis. Note that R2 for lhy cca1 was not significant (<0.5) from any regression analysis performed (linear regression shown here). Asterisks denote statistical significance compared with lhy cca1 at each time point as determined by Student’s t test (P < 0.05). DW, dry weight of seedlings. All individual values are provided in Supplemental Data Set 3. (F) Seed oil content. Triacylglycerols extracted from dry seeds were transmethylated and the resulting fatty acid methyl esters were quantified by gas chromatography. Values are % of dry seed weight and mean ± SD (n = 5; for each plant line, five independent groups of dry seeds harvested at the same time were used for lipid extraction and GC analysis). Asterisks denote statistical significance compared with WT as determined by Student’s t test (P < 0.01). OE, transgenic plant overexpressing LHY.
Figure 11.
Figure 11.
Proposed Model for Reciprocal Regulation of Circadian Clock and Lipid Metabolism. PA binds to LHY and CCA1 and perturbs the circadian clock by suppressing their binding to TOC1 promoter. Reciprocally, the clock oscillators regulate the expression of genes involved in lipid metabolism to tune membrane and storage lipids including PA.

Similar articles

Cited by

References

    1. Alabadí D., Oyama T., Yanovsky M.J., Harmon F.G., Más P., Kay S.A. (2001). Reciprocal regulation between TOC1 and LHY/CCA1 within the Arabidopsis circadian clock. Science 293: 880–883. - PubMed
    1. Arisz S.A., Testerink C., Munnik T. (2009). Plant PA signaling via diacylglycerol kinase. Biochim. Biophys. Acta 1791: 869–875. - PubMed
    1. Asher G., Schibler U. (2011). Crosstalk between components of circadian and metabolic cycles in mammals. Cell Metab. 13: 125–137. - PubMed
    1. Atamian H.S., Creux N.M., Brown E.A., Garner A.G., Blackman B.K., Harmer S.L. (2016). Circadian regulation of sunflower heliotropism, floral orientation, and pollinator visits. Science 353: 587–590. - PubMed
    1. Baldanzi G., Bettio V., Malacarne V., and Graziani A. (2016). Diacylglycerol kinases: Shaping diacylglycerol and phosphatidic acid gradients to control cell polarity. Front Cell Dev Biol. 4: 140. - PMC - PubMed

Publication types

MeSH terms