. 2019 Jan 24;4(2):e125067.
doi: 10.1172/jci.insight.125067.

Macrophage IFN-I signaling promotes autoreactive T cell infiltration into islets in type 1 diabetes model

Macrophage IFN-I signaling promotes autoreactive T cell infiltration into islets in type 1 diabetes model

Brett S Marro et al. JCI Insight. .

Abstract

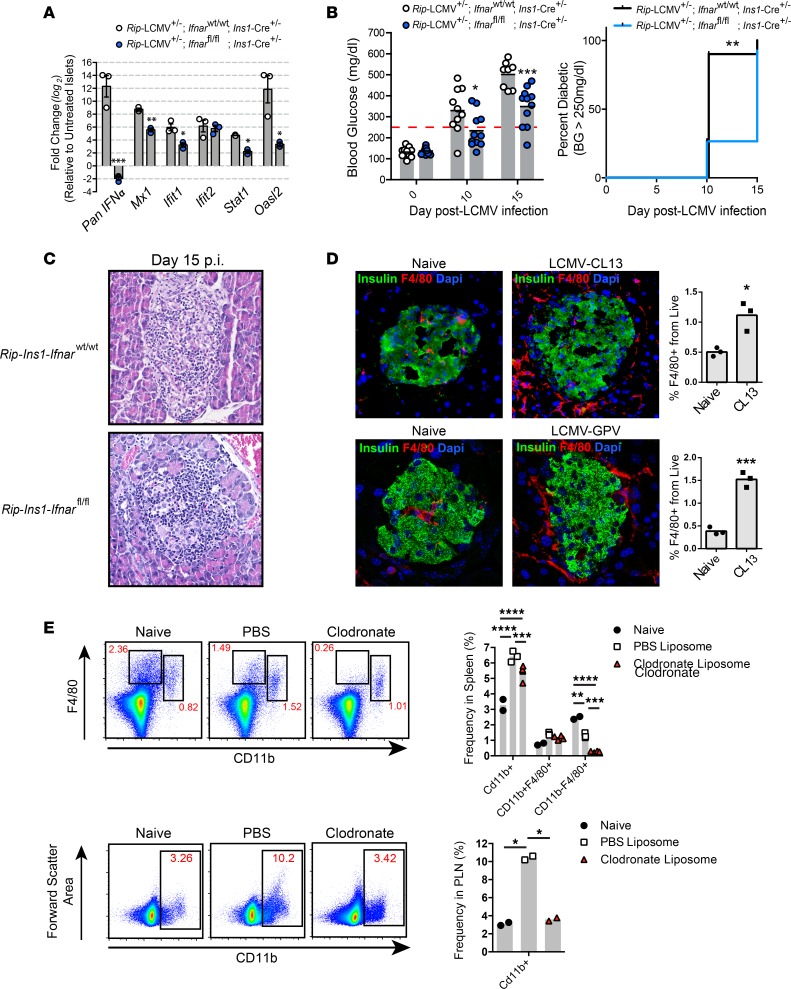
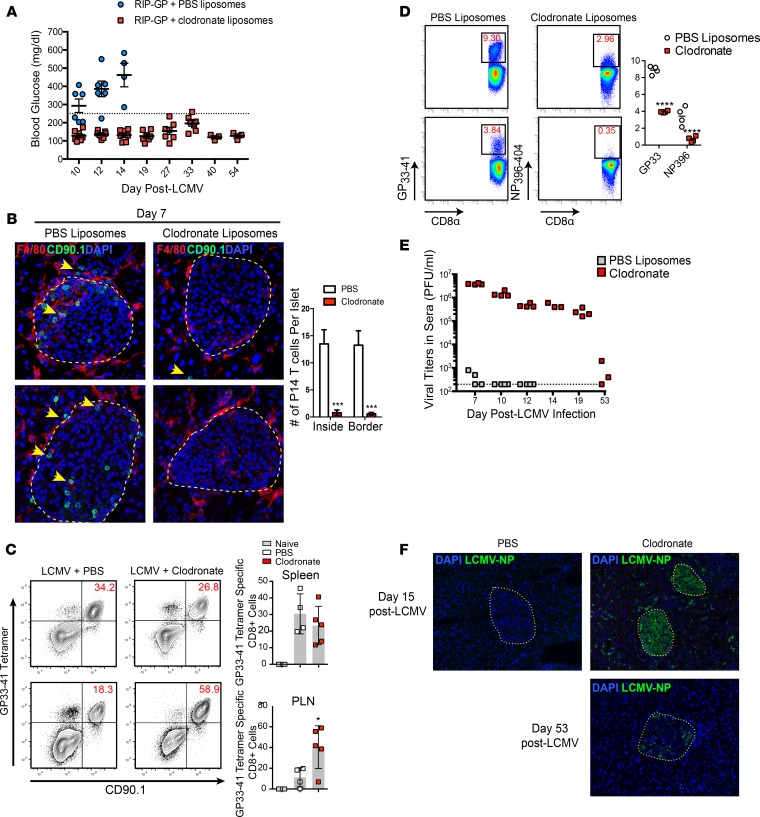
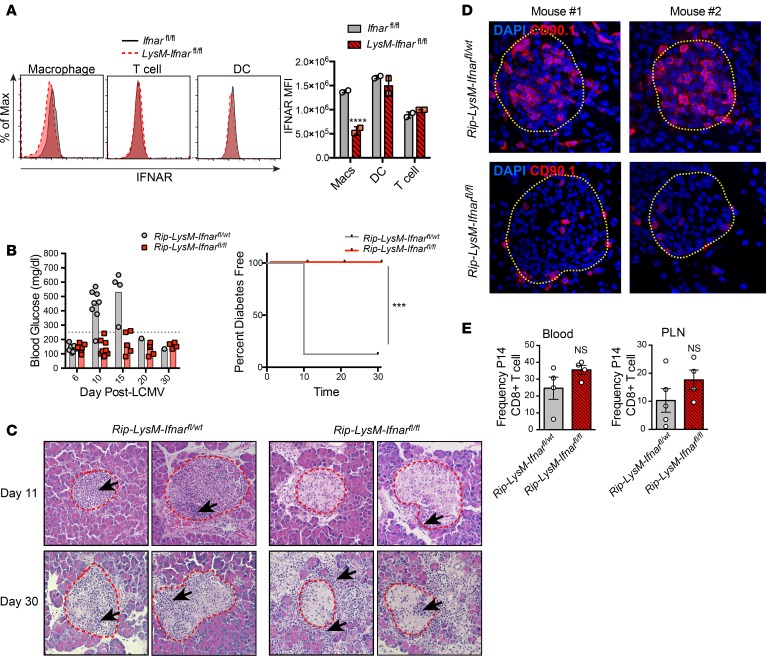
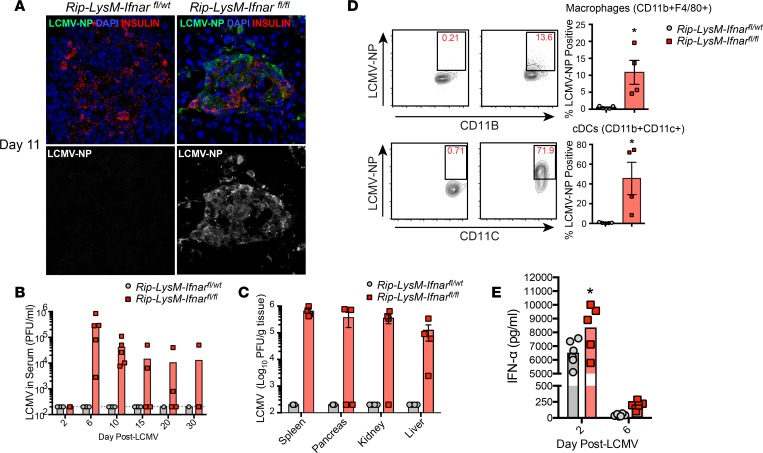
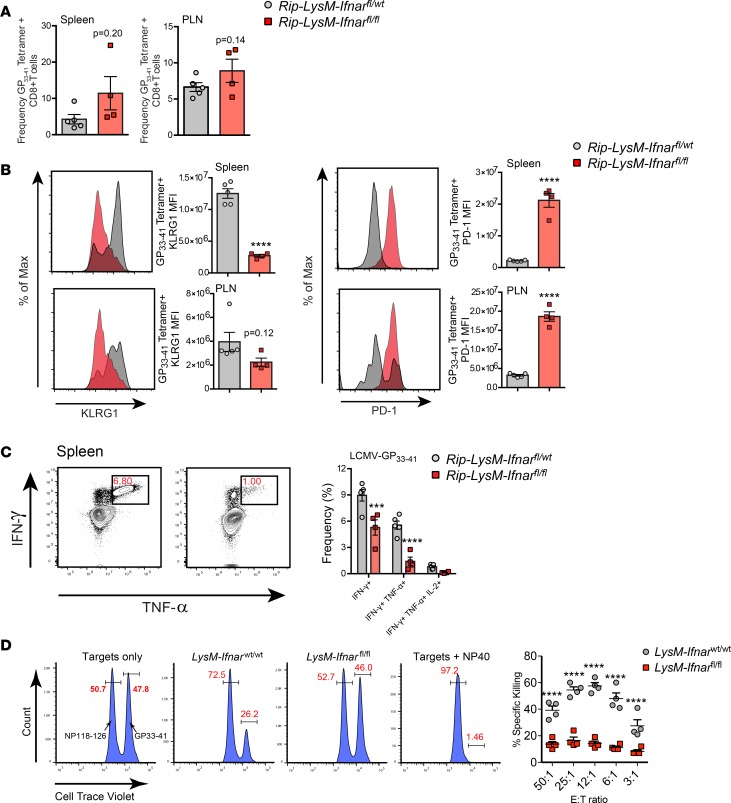
Here, we report a pathogenic role for type I IFN (IFN-I) signaling in macrophages, and not β cells in the islets, for the development of type 1 diabetes (T1D). Following lymphocytic choriomeningitis (LCMV) infection in the Rip-LCMV-GP T1D model, macrophages accumulated near islets and in close contact to islet-infiltrating GP-specific (autoimmune) CD8+ T cells. Depletion of macrophages with clodronate liposomes or genetic ablation of Ifnar in macrophages aborted T1D, despite proliferation of GP-specific (autoimmune) CD8+ T cells. Histopathologically, disrupted IFNα/β receptor (IFNAR) signaling in macrophages resulted in restriction of CD8+ T cells entering into the islets with significant lymphoid accumulation around the islet. Collectively, these results provide evidence that macrophages via IFN-I signaling, while not entering the islets, are directly involved in interacting, directing, or restricting trafficking of autoreactive-specific T cells into the islets as an important component in causing T1D.

Keywords: Autoimmunity; Cytokines; Diabetes; Immunology; Macrophages.


Conflict of interest statement

Conflict of interest: The authors have declared that no conflict of interest exists.

Figures

Figure 1
Figure 1. Expression of IFNAR in insulin-producing β cells has a minor role in the development of T1D.
(A) qPCR analysis of IFNα, Mx1, Ifit1, Ifit2, Stat1, and Oasl2 mRNA expression in pancreatic islets isolated from Rip-Ins1-Ifnarfl/fl and Rip-Ins1-Ifnarfl/wt mice. Islets were cultured in the presence of IFN-β (100 U/ml) for 12 hours prior to RNA extraction. (B) Blood glucose levels and T1D incidence over a 15-day postinfection period. (C) Representative H&E images (20× magnification) of the pancreatic islets from Rip-Ins1-Ifnarfl/fl and Rip-Ins1-Ifnarfl/wt mice at day 15 p.i. (D) Pancreata were isolated at day 5 p.i. from Rip-GP mice infected i.p. with 2 × 10⁵ PFU LCMV or 2 × 10⁵ LCMV-GPV. Half pancreata was stained via immunofluorescence with antibody to insulin and F4/80 (40× magnification). Macrophages were examined in the second half of pancreatic tissue by flow cytometry by gating on CD45+F4/80+ cells. (E) Frequency of CD11b+ cells in the spleens and PLNs of clodronate liposome–treated mice at day 3 after LCMV infection. qPCR analysis was performed on RNA isolated from islets of 3 mice per group. Fold change in gene expression was relative to islets treated with vehicle control (PBS). Data are presented as average ± SEM; statistical significance was measured using an unpaired 2-tailed Student t test or 1-way ANOVA analysis. Statistical significant of T1D disease incidence was measured using a log-rank (Mantel-Cox) test. *P < 0.05, **P < 0.01, ***P < 0.001, ****P < 0.0001.
Figure 2
Figure 2. Clodronate liposome–induced depletion of macrophages prevents T1D disease.
(A) Blood glucose levels of clodronate treated mice during a 54-day observation period. (B) Immunofluorescence inspection of (40× magnification) LCMV-GP33–41–specific CD8+ P14 T cells and F4/80+ macrophages in the islets of clodronate or PBS liposome–treated mice at day 6 p.i. Yellow outlines represent islet boundaries, and yellow arrows show P14 CD8+ T cells. (C) Examination of P14 CD8+ T cells in the spleen and pancreatic lymph nodes (PLN) of clodronate liposome–treated mice at day 6 p.i. using flow cytometry. (D) Frequency of LCMV-GP33–41 tetramer–positive and LCMV396–404 tetramer–positive CD8+ T cells in the spleens of clodronate treated mice at day 8 p.i. (E) Viral titers in the sera were measured by plaque assay over a 53-day post-infection period. (F) Anti–LCMV-NP staining (20× magnification) of pancreatic tissue from clodronate-treated mice at days 15 and 53 p.i. Yellow outlines depict islet boundaries. Flow cytometry data of P14 T cells represents at least 4 mice per group. Immunofluorescence analysis of islet-infiltrating T cells is an average of at least 8 islets per mouse and a total of 4 mice per group. Statistical significance was measured using 1-way ANOVA. Data are presented as average ± SEM. *P < 0.05, ****P < 0.0001
Figure 3
Figure 3. Genetic deletion of Ifnar from macrophages spares mice from T1D.
(A) IFNAR expression levels (based on mean fluorescence intensity; MFI) on defined cellular subsets in the spleens of Rip-LysM-Ifnarfl/fl mice compared with Ifnarfl/fl mice. The following markers were used to gate splenic cell subsets: macrophages (CD11b+CD11cF4/80+), T cells (CD3+), and DCs (CD11bCD11c+). Statistical significance was measured using 2-way ANOVA. (B) Rip-LysM-Ifnarfl/fl and Rip-LysM-Ifnarfl/wt mice were infected with LCMV-Cl13, and BG levels were monitored over at 30-day period. Clinical diabetes was confirmed in mice that displayed BG levels significantly over >250mg/dl. (C) H&E staining (20× magnification) of pancreata from mice at day 11 p.i. and day 30 p.i. Red outlines depict islet boundaries. (D) Immunofluorescence detection (40× magnification) of P14 CD8+ T cells expressing the congenic surface marker CD90.1 in the pancreata of Rip-LysM-Ifnarfl/fl and Rip-LysM-Ifnarfl/wt at day 10 p.i. Yellow outlines depict islet boundaries. (E) Frequencies of P14 CD8+ T cells in the blood and PLN at day 10 p.i. IFNAR expression levels in the spleen are derived from 2 mice per group. Representative immunofluorescence images of P14 CD8+ T cells are derived from 4 mice per group. Black arrows in C represent areas of significant lymphoid accumulation. Statistical significant of T1D disease incidence was measured using a log-rank (Mantel-Cox) test. Data presented as average ± SEM. ***P < 0.001, ****P < 0.0001.
Figure 4
Figure 4. Loss of IFNAR signaling in macrophages results in systemic spread of LCMV.
(A) Immunofluorescence analysis (40× magnification) of LCMV-NP antigen in pancreas tissue of Rip-LysM-Ifnarfl/fl mice. (B and C) LCMV titers were recorded in the serum (B) and spleen, pancreas, kidney and liver (C) at day 11 p.i. by viral plaque assay. (D) Detection of the nucleoprotein (NP) of LCMV in macrophages (F4/80+CD11b+) and conventional dendritic cells (cDCs, CD11b+CD11c+) in the spleens at day 11 p.i. (E) IFN-α protein levels were measured in the serum of Rip-LysM-Ifnarfl/fl and Rip-LysM-Ifnarfl/wt mice at days 2 and 6 p.i. Statistical significance was measured using an unpaired 2-tailed Student t test or 1-way ANOVA analysis. Data presented as average ± SEM. *P < 0.05.
Figure 5
Figure 5. Diminished GP-specific CD8+ effector T cell responses in Rip-LysM-Ifnarfl/fl mice.
(A) Frequencies of LCMV-GP33–41 tetramer–positive CD8+ T cells in the spleens and PLNs at day 11 p.i. (B) Median fluorescence intensity (MFI) of PD-1 and KLRG1 at the surface of LCMV-GP33–41 tetramer–positive CD8+ T cells at day 11 p.i. (C) Detection of IFN-γ, TNF-α, and IL-2 in CD8+ T cells following ex vivo restimulation of splencoytes from Rip-LysM-Ifnarfl/fl mice with LCMV-GP33–41 peptide at day 11 p.i. (D) Specific lysis of target splenocytes loaded with CellTrace violet (CTV) and LCMV-GP33–41 (H-2b, CTVhi population) or NP118–126 (H-2d, CTVlo population) peptides. Statistical significance was measured using an unpaired 2-tailed Student t test, one-way ANOVA analysis or 2-way ANOVA analysis. Data presented as average ± SEM. ***P < 0.001, ****P < 0.0001.

References

    1. Foulis AK, Farquharson MA, Meager A. Immunoreactive alpha-interferon in insulin-secreting beta cells in type 1 diabetes mellitus. Lancet. 1987;2(8573):1423–1427. - PubMed
    1. Huang X, et al. Interferon expression in the pancreases of patients with type I diabetes. Diabetes. 1995;44(6):658–664. - PubMed
    1. Pelegrin M, et al. Evidence from transgenic mice that interferon-beta may be involved in the onset of diabetes mellitus. J Biol Chem. 1998;273(20):12332–12340. doi: 10.1074/jbc.273.20.12332. - DOI - PubMed
    1. Alba A, et al. IFN beta accelerates autoimmune type 1 diabetes in nonobese diabetic mice and breaks the tolerance to beta cells in nondiabetes-prone mice. J Immunol. 2004;173(11):6667–6675. doi: 10.4049/jimmunol.173.11.6667. - DOI - PubMed
    1. Stewart TA. Neutralizing interferon alpha as a therapeutic approach to autoimmune diseases. Cytokine Growth Factor Rev. 2003;14(2):139–154. doi: 10.1016/S1359-6101(02)00088-6. - DOI - PubMed