

Computer Simulations of Static and Dynamical Properties of Weak Polyelectrolyte Nanogels in Salty Solutions
- PMID: 30674778
- PMCID: PMC6318681
- DOI: 10.3390/gels4010002
Computer Simulations of Static and Dynamical Properties of Weak Polyelectrolyte Nanogels in Salty Solutions
Abstract
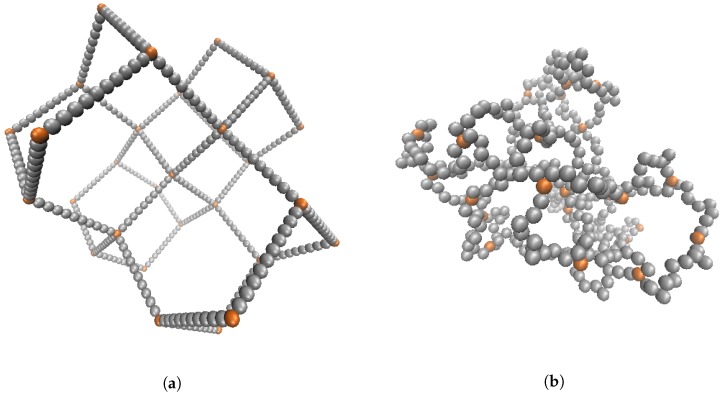
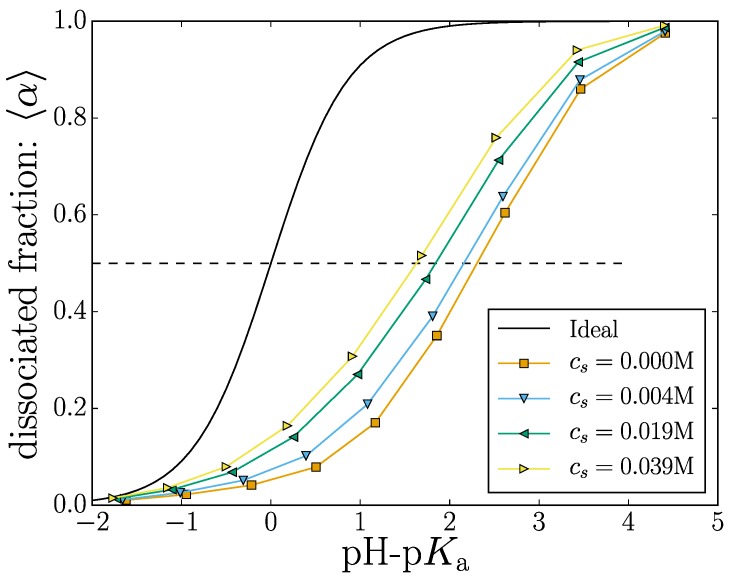
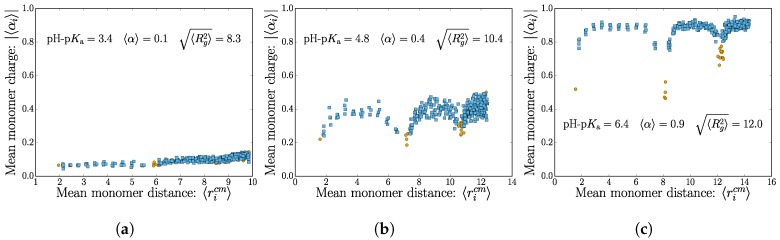
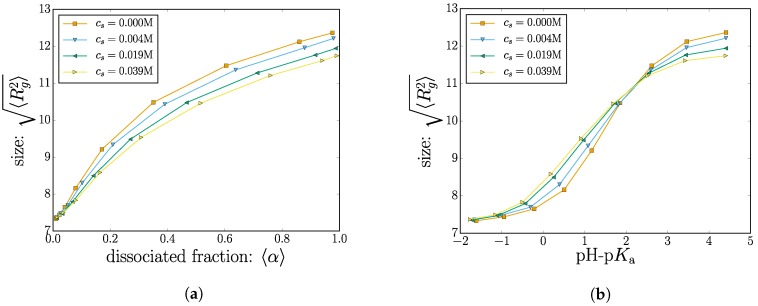
We investigate the chemical equilibria of weak polyelectrolyte nanogels with reaction ensemble Monte Carlo simulations. With this method, the chemical identity of the nanogel monomers can change between neutral or charged following the acid-base equilibrium reaction HA ⇌ A- + H⁺. We investigate the effect of changing the chemical equilibria by modifying the dissociation constant K a . These simulations allow for the extraction of static properties like swelling equilibria and the way in which charge-both monomer and ionic-is distributed inside the nanogel. Our findings reveal that, depending on the value of K a , added salt can either increase or decrease the gel size. Using the calculated mean-charge configurations of the nanogel from the reaction ensemble simulation as a quenched input to coupled lattice-Boltzmann molecular dynamics simulations, we investigate dynamical nanogel properties such as the electrophoretic mobility μ and the diffusion coefficient D.
Keywords: computer simulations; electrophoresis; molecular dynamics; nanogels; reaction ensemble Monte Carlo; weak polyelectrolytes.
Conflict of interest statement
The authors declare no conflict of interest.
Figures
Similar articles
-
Influence of weak groups on polyelectrolyte mobilities.Electrophoresis. 2019 Mar;40(5):799-809. doi: 10.1002/elps.201800346. Epub 2019 Jan 25. Electrophoresis. 2019. PMID: 30645004
-
Temperature-sensitive nanogels in the presence of salt: explicit coarse-grained simulations.J Chem Phys. 2014 Sep 28;141(12):124903. doi: 10.1063/1.4895960. J Chem Phys. 2014. PMID: 25273470
-
Simulations of ionization equilibria in weak polyelectrolyte solutions and gels.Soft Matter. 2019 Feb 6;15(6):1155-1185. doi: 10.1039/c8sm02085j. Soft Matter. 2019. PMID: 30706070 Review.
-
Influence of network topology on the swelling of polyelectrolyte nanogels.J Chem Phys. 2016 Mar 21;144(11):114903. doi: 10.1063/1.4943981. J Chem Phys. 2016. PMID: 27004897
-
Advancement in nanogel formulations provides controlled drug release.Int J Pharm. 2020 Jun 30;584:119435. doi: 10.1016/j.ijpharm.2020.119435. Epub 2020 May 19. Int J Pharm. 2020. PMID: 32439585 Review.
Cited by
-
Coarsening Kinetics of Complex Macromolecular Architectures in Bad Solvent.Polymers (Basel). 2020 Mar 2;12(3):531. doi: 10.3390/polym12030531. Polymers (Basel). 2020. PMID: 32121665 Free PMC article.
-
Numerical modelling of non-ionic microgels: an overview.Soft Matter. 2019 Feb 6;15(6):1108-1119. doi: 10.1039/c8sm02089b. Soft Matter. 2019. PMID: 30543246 Free PMC article. Review.
References
-
- Maccarrone S., Ghavami A., Holderer O., Scherzinger C., Lindner P., Richtering W., Richter D., Winkler R.G. Dynamic structure factor of core-shell microgels: A neutron scattering and mesoscale hydrodynamic simulation study. Macromolecules. 2016;49:3608–3618. doi: 10.1021/acs.macromol.6b00232. - DOI
LinkOut - more resources
Full Text Sources
Research Materials
