. 2019 Jan 23;10(1):392.
doi: 10.1038/s41467-018-08200-y.

Exploring the landscape of focal amplifications in cancer using AmpliconArchitect

Affiliations

Exploring the landscape of focal amplifications in cancer using AmpliconArchitect

Viraj Deshpande et al. Nat Commun. .

Abstract

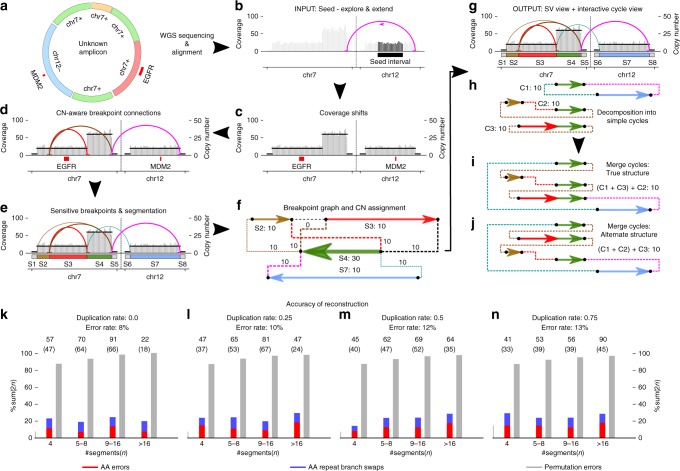
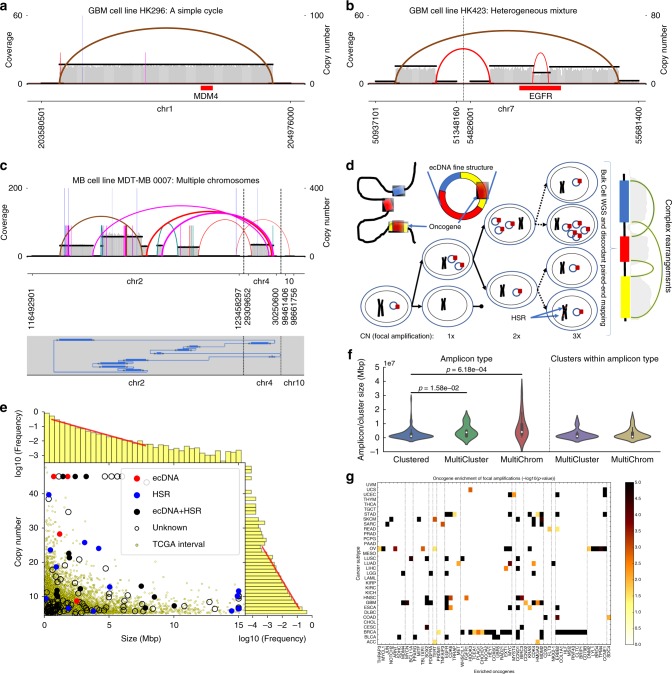
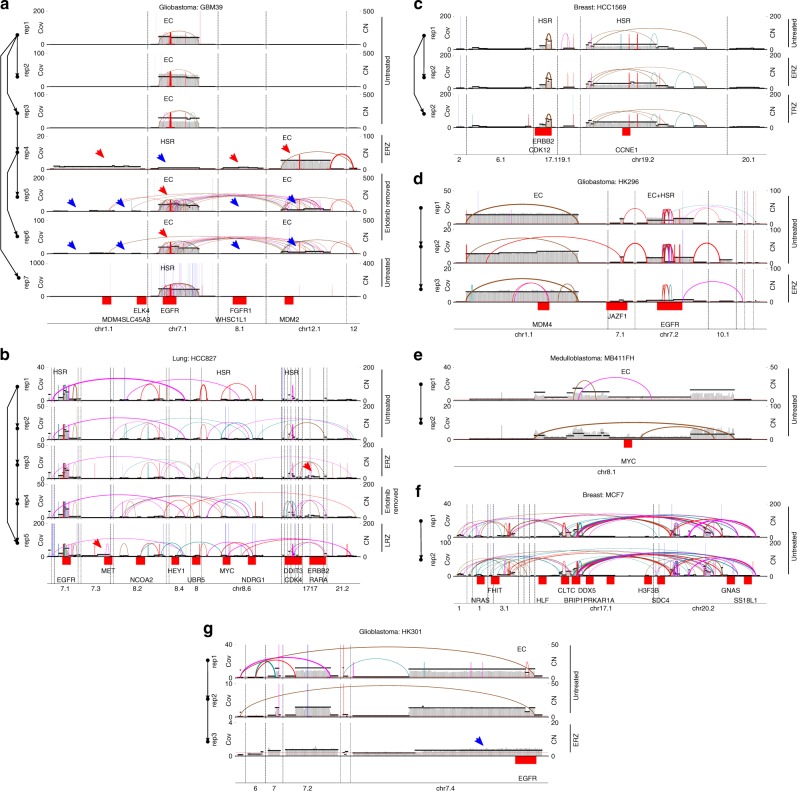
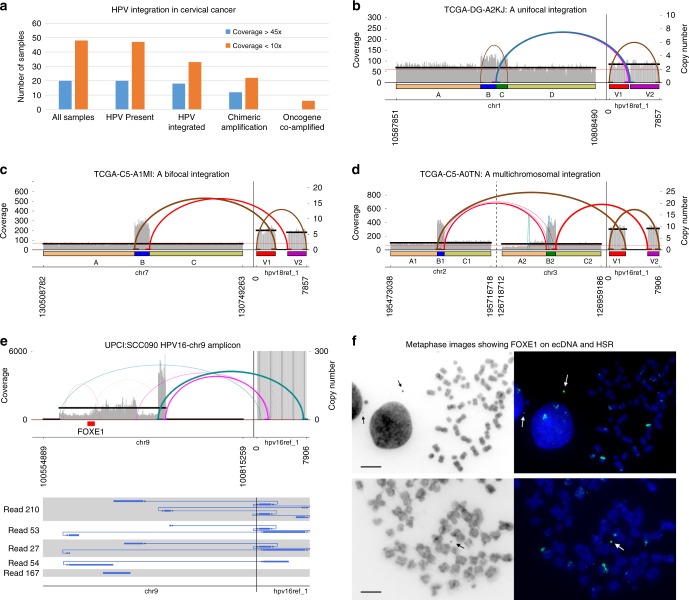
Focal oncogene amplification and rearrangements drive tumor growth and evolution in multiple cancer types. We present AmpliconArchitect (AA), a tool to reconstruct the fine structure of focally amplified regions using whole genome sequencing (WGS) and validate it extensively on multiple simulated and real datasets, across a wide range of coverage and copy numbers. Analysis of AA-reconstructed amplicons in a pan-cancer dataset reveals many novel properties of copy number amplifications in cancer. These findings support a model in which focal amplifications arise due to the formation and replication of extrachromosomal DNA. Applying AA to 68 viral-mediated cancer samples, we identify a large fraction of amplicons with specific structural signatures suggestive of hybrid, human-viral extrachromosomal DNA. AA reconstruction, integrated with metaphase fluorescence in situ hybridization (FISH) and PacBio sequencing on the cell-line UPCI:SCC090 confirm the extrachromosomal origin and fine structure of a Forkhead box E1 (FOXE1)-containing hybrid amplicon.


Conflict of interest statement

V.B. is a co-founder, has an equity interest from Digital Proteomics, LLC (DP) and receives income from DP. V.B. and P.S.M. are co-founders and V.B., V.D., and P.S.M. have equity interest in Pretzel Therapeutics, Inc. (PT). The terms of these arrangements have been reviewed and approved by the University of California, San Diego in accordance with its conflict of interest policies. Digital Proteomics and Pretzel Therapeutics were not involved in the research presented here. The remaining authors declare no competing interests.

Figures

Fig. 1
Fig. 1
Schematic of AmpliconArchitect (AA). AA takes as input: a aligned whole-genome sequencing data from a sample with an amplicon, and b a seed interval from the amplicon. It automatically searches for and identifies other intervals that are part of the same amplicon; c Next, AA identifies breakpoints by segmenting intervals at positions with a sharp change in copy number, or d containing a cluster of discordant paired-end reads. Finally, e AA refines breakpoint locations and partitions the intervals into smaller segments. f The collection of segments and breakpoints is used to generate a breakpoint graph and a balanced flow approach is used to refine segment copy numbers. Arrows represent the orientation of a segment from lower to higher coordinate. g, h The entire graph describes a breakpoint signature and a succinct “SV view” of the amplicon, which is also decomposed into short basis cycles in the “Cycle view”. See Supplementary Figure 1 for detailed description. i, j Alternative merging of the short cycles with overlapping segments can generate multiple amplicon architectures consistent with the short-read data. kn Amplicon reconstruction on a variety of simulations showed high fidelity of reconstruction (red bar, 11% error) relative to a random “permutation predictor” (gray bar, 85% error). Swaps (blue bars) represent cases with alternative structures supported by the data. Numbers above each bin represent total number of simulations in the bin and numbers in parenthesis represent number of simulations reconstructed without errors. Source data are provided as a Source Data file
Fig. 2
Fig. 2
Structural variant (SV) view of AmpliconArchitect (AA) reconstructions. The SV View of reconstructed amplicon structures shows a simple cycles; b heterogeneity with amplicons containing Epidermal Growth Factor Receptor (EGFR) VIII deletion, as well as the intact EGFR; and c SV view and Cycle view of the complex medulloblastoma multi-chromosomal amplification. d A model for extrachromosomal DNA (ecDNA)-mediated focal amplification. e AA amplified intervals compared against 12,162 amplified TCGA intervals shows significant overlap. The interval sizes (mean 1.74 Mb) and copy numbers (mean 3.16 copies) are exponentially distributed, with no clear distinction between homogenously staining region (HSR) and ecDNA amplicons (Supplementary Data 4). f Amplicons containing multiple genomic regions from the same chromosome (MultiCluster) or multiple chromosomes (MultiChrom) are significantly larger in size (p-value < 0.016, Wilcoxon Rank-Sum test) than amplicons containing intervals from a single chromosomal region (Clustered). However, the size distribution of individual intervals in clustered amplicons is similar to the size distribution of intervals in MultiChrom or MultiCluster amplicons (Supplementary Data 4). g Heatmap of negative log p-values (Bonferroni-corrected Poisson Binomial) showing enrichment of 59 oncogenes in amplifications in 33 cancer types. Source data are provided in a Source Data file
Fig. 3
Fig. 3
AmpliconArchitect (AA) amplicons evolving over time or in response to drug treatment: a GBM39: patient-derived xenograft (PDX), glioblastoma; b HCC827: Cell-line, lung; c HCC1569: Cell-line, breast; d HK296: Cell-line, glioblastoma; e MB411FH: Cell-line, medulloblastoma; f MCF7: Cell-line, breast; g HK301: Cell-line, GBM. For each sample, one row per replicate shows a combined structural variant (SV) view of all amplicons including intervals amplified in other biological replicates of that sample. The left axis shows replicate ID and passage of cell line or PDX, whereas right axis shows the condition of the replicate: Untreated, undergoing drug treatment or after drug removal; ERZ: erlotinib resistant; LRZ: lapatinib resistant; TRZ: trastuzumab resistant. Within each replicate, known locations of oncogenes, EC (ecDNA), HSR or EC + HSR, as determined by FISH, are indicated in the corresponding replicate row. Red and blue arrows, respectively, indicate a gain and loss in copy number or formation of new amplicons with respect to parent cell line or PDX
Fig. 4
Fig. 4
Amplicon structures near viral insertions. a Human papillomavirus (HPV) sequence was identified in 67 of 68 tumor whole-genome sequencing (WGS) samples (with genomic integration in 51) compared with 0 of 68 in matched normal blood samples. Forty-one fusion amplicons were reconstructed in 33 samples (Supplementary Data 7, 8). b Although 14 of the viral insertions gave a unifocal amplification signature, consistent with viral insertion at a specific genomic location, c 32 amplicons showed a bifocal signature. d A two-way bifocal signature in sample TCGA-C5-A0TN with two segments from chr2 and chr3 connected to a viral segment in a circular or tandemly duplicated structure with 10 copies. The prevalence of bifocal signatures is suggestive of hybrid extrachromosomal DNA (ecDNA) elements containing virus and human sequence (Supplementary Data 8). e AA reconstruction of a complex hybrid structure (>100 kbp) containing the oncogene FOXE1. The Cycle view shows paths traced by PacBio reads validating the AmpliconArchitect (AA) structures. f Metaphase images of cells in metaphase of UPCI:SCC090 stained with DAPI (left: black, right: blue) and FISH on a FOXE1 probe (green) indicating the presence of ecDNA (arrow), as well as numerous HSRs containing FOXE1. Sizes of the black bars in the DAPI images correspond to 200 μm in the respective DAPI and FISH images

References

    1. Zack TI, et al. Pan-cancer patterns of somatic copy number alteration. Nat. Genet. 2013;45:1134–1140. doi: 10.1038/ng.2760. - DOI - PMC - PubMed
    1. Malhotra A, et al. Breakpoint profiling of 64 cancer genomes reveals numerous complex rearrangements spawned by homology-independent mechanisms. Genome Res. 2013;23:762–776. doi: 10.1101/gr.143677.112. - DOI - PMC - PubMed
    1. Storlazzi CT, et al. Gene amplification as double minutes or homogeneously staining regions in solid tumors: origin and structure. Genome Res. 2010;20:1198–1206. doi: 10.1101/gr.106252.110. - DOI - PMC - PubMed
    1. L’Abbate A, et al. Genomic organization and evolution of double minutes/homogeneously staining regions with MYC amplification in human cancer. Nucleic Acids Res. 2014;42:9131–9145. doi: 10.1093/nar/gku590. - DOI - PMC - PubMed
    1. Stephens PJ, et al. Massive genomic rearrangement acquired in a single catastrophic event during cancer development. Cell. 2011;144:27–40. doi: 10.1016/j.cell.2010.11.055. - DOI - PMC - PubMed

Publication types

Substances