. 2019 Jan 23;10(1):386.
doi: 10.1038/s41467-019-08288-w.

In vivo proximity proteomics of nascent synapses reveals a novel regulator of cytoskeleton-mediated synaptic maturation

Affiliations

In vivo proximity proteomics of nascent synapses reveals a novel regulator of cytoskeleton-mediated synaptic maturation

Erin F Spence et al. Nat Commun. .

Abstract

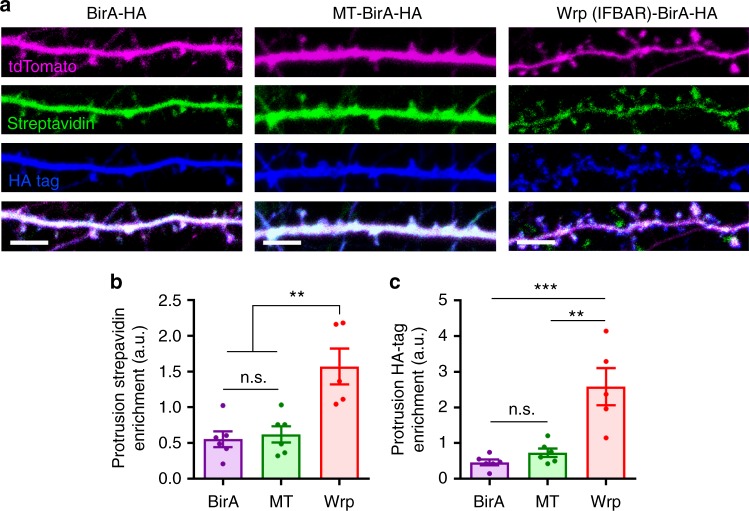
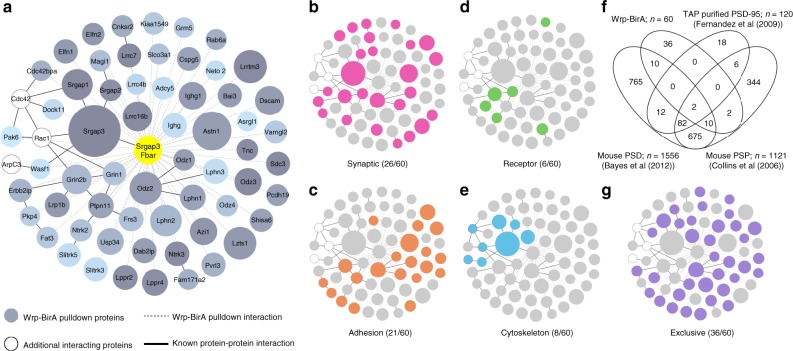
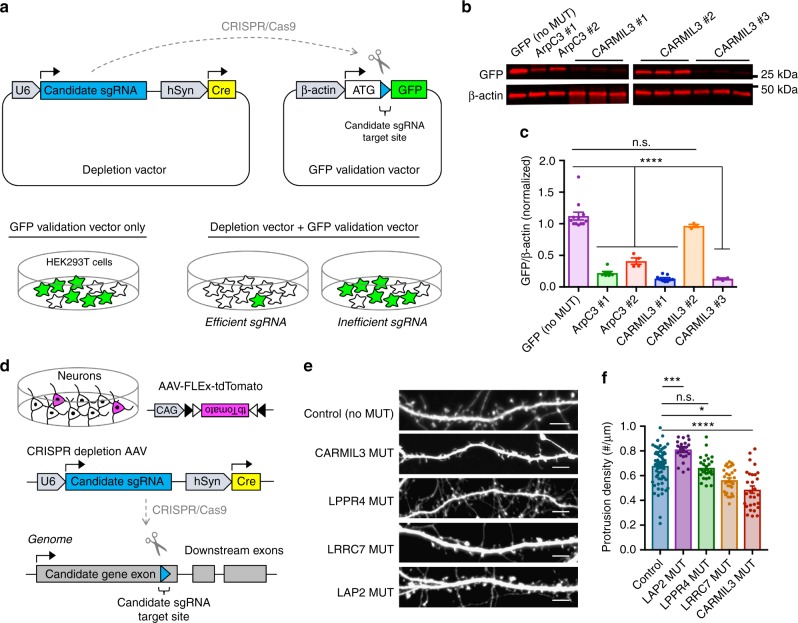
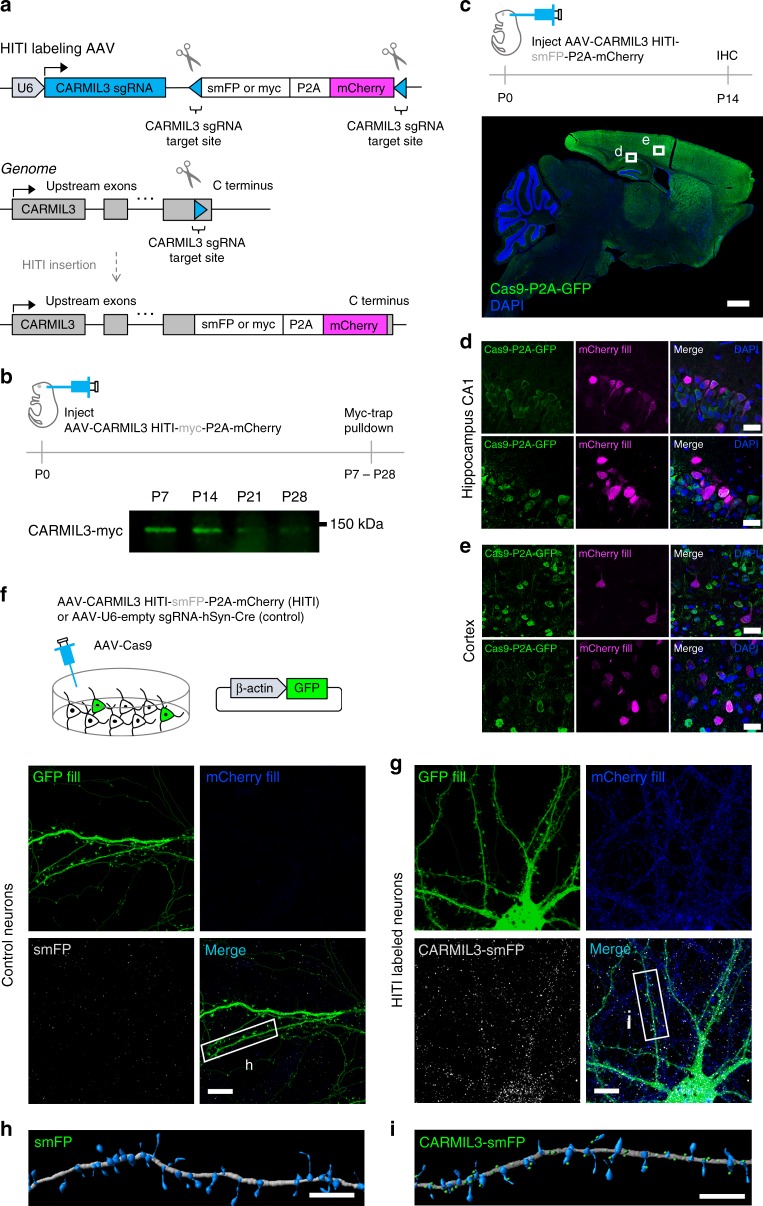
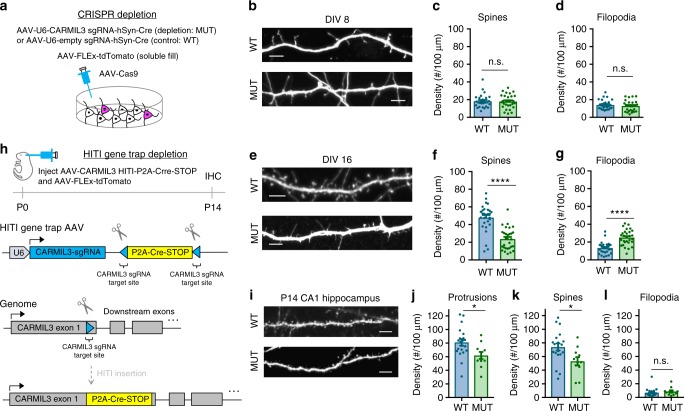
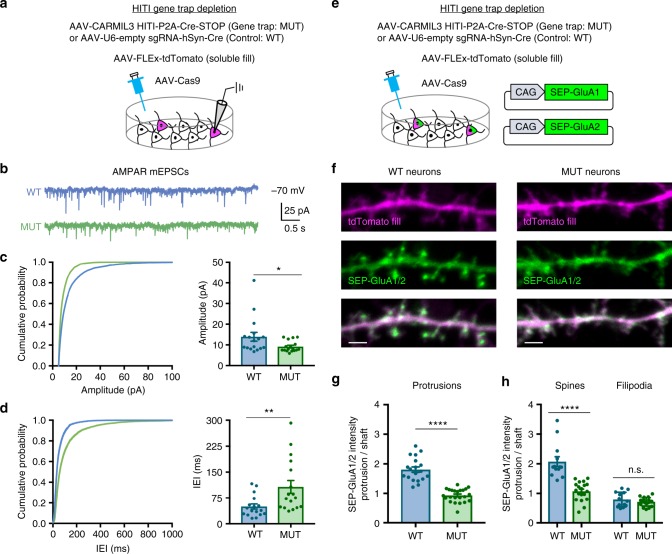
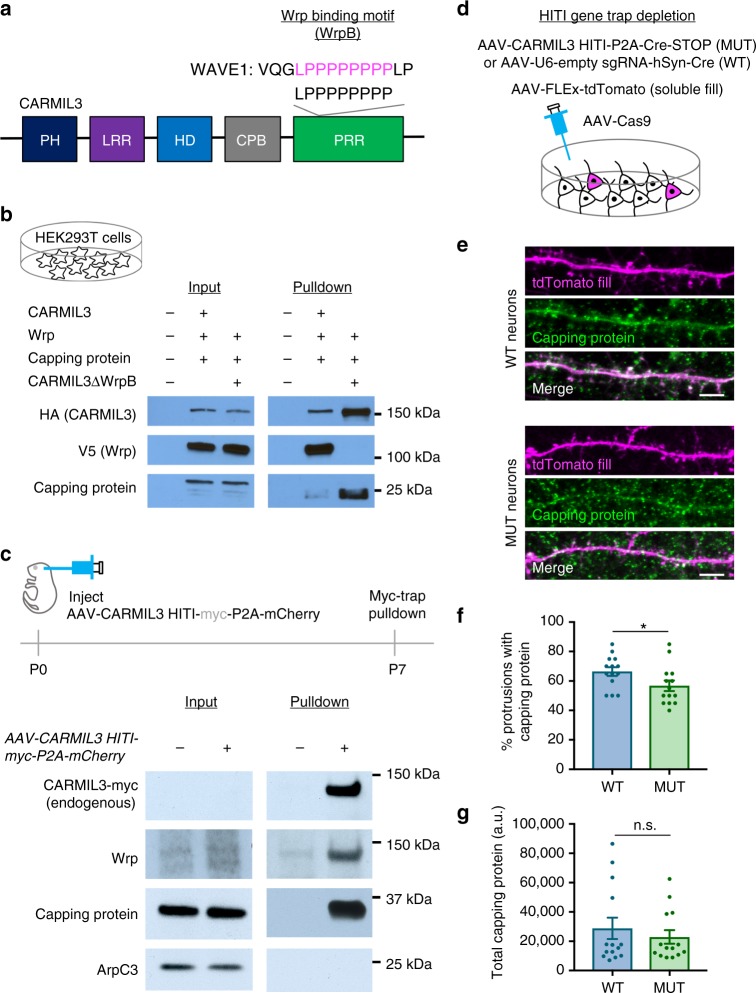
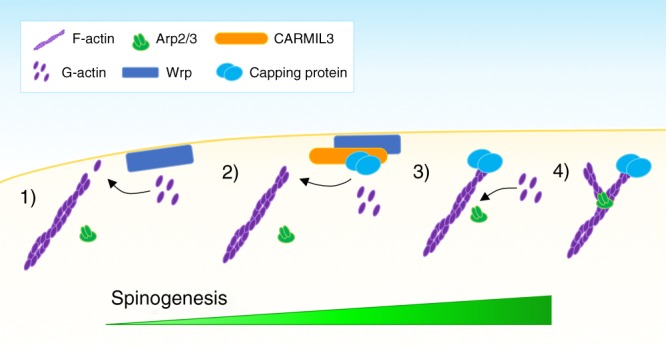
Excitatory synapse formation during development involves the complex orchestration of both structural and functional alterations at the postsynapse. However, the molecular mechanisms that underlie excitatory synaptogenesis are only partially resolved, in part because the internal machinery of developing synapses is largely unknown. To address this, we apply a chemicogenetic approach, in vivo biotin identification (iBioID), to discover aspects of the proteome of nascent synapses. This approach uncovered sixty proteins, including a previously uncharacterized protein, CARMIL3, which interacts in vivo with the synaptic cytoskeletal regulator proteins SrGAP3 (or WRP) and actin capping protein. Using new CRISPR-based approaches, we validate that endogenous CARMIL3 is localized to developing synapses where it facilitates the recruitment of capping protein and is required for spine structural maturation and AMPAR recruitment associated with synapse unsilencing. Together these proteomic and functional studies reveal a previously unknown mechanism important for excitatory synapse development in the developing perinatal brain.


Conflict of interest statement

The authors declare no competing interests.

Figures

Fig. 1
Fig. 1
Wrp-BirA localizes to and biotinylates proteins within nascent dendritic spines. a Representative images of cultured neurons expressing either BirA (Control), Membrane-Tag-BirA (MT-BirA), or Wrp(IFBAR)-BirA (Wrp-BirA). Co-transfected tandem dimer Tomato fluorescent protein (tdTomato) fill is shown in magenta, streptavidin staining is shown in green, and the HA tag for each construct is shown in blue. Scale bars are 5 μm. b Graph depicting streptavidin enrichment in dendritic protrusions vs the dendrite for each BirA (0.555 ± 0.110 spine intensity: dendrite intensity, n=6 neurons), MT-BirA (0.622 ± 0.113 spine intensity: dendrite intensity, n=6 neurons), and Wrp-BirA (1.353 ± 0.300 spine intensity: dendrite intensity, n=6 neurons). F2,15=5.138, p=0.020. c Graph depicting streptavidin enrichment in dendritic protrusions vs the dendrite for BirA (0.465 ± 0.080 spine intensity: dendrite intensity, n=6 neurons), MT-BirA (0.732 ± 0.118 spine intensity: dendrite intensity, n=6 neurons), and Wrp-BirA (2.269 ± 0.530 spine intensity: dendrite intensity, n=5 neurons). F2,8.591=6.452, p=0.019. Error bars are standard error of the mean (SEM). *p<0.05; **p<0.01, one-way ANOVAs
Fig. 2
Fig. 2
Proteome of developing dendritic protrusions. a Wrp-BirA-dependent iBioID identified a network of known and unknown proteins enriched in dendritic filopodia early in spinogenesis. Node titles correspond to the gene name, size represents fold enrichment over the BirA negative control (range 2.45–23.73), shading represents p-value with light gray being a lower p-value and darker gray a higher p-value (range 9.06 × 10−5–0.05). Edges are marked according to type of interaction. Dashed lines are iBioID interactions where as solid lines are previously known interactions identified in the Genemania, Biogrid, or String databases. b Clustergram of synaptic proteins (pink) as identified through DAVID analysis or the G2C database of Cortex PSD Consensus proteins. c Clustergram of adhesion proteins (orange) as identified through DAVID analysis. d Clustergram of receptor proteins (green) as identified through DAVID analysis. e Clustergram of cytoskeletal proteins (blue) as identified through DAVID analysis. f Venn diagram of Wrp-BirA proteome compared to three previously published proteomes of mature postsynapses. g Clustergram of proteins found exclusively in the Wrp-BirA network in comparison to mature postsynaptic proteomes (purple)
Fig. 3
Fig. 3
Candidate screening for functional role in filopodia maturation. a Schematic depicting the depletion and GFP validation vectors for in vitro guide screening. U6 U6 promoter, sgRNA single guide RNA, hSyn human Synapsin I promoter, Cre cre recombinase, β-actin beta actin promoter, GFP green fluorescent protein. b Representative blot for GFP to validate depletion efficiency of sgRNA sequences. c Graphical representation of GFP/β-actin intensity relative to no depletion control (GFP alone) (1.12 ± 0.06 GFP intensity, n=12 HEK cell samples), ArpC3 #1 (0.22 ± 0.02, n=7 samples), ArpC3 #2 (0.41 ± 0.05, n=4 samples), CARMIL3 #1 (0.13 ± 0.02, n=9 samples), CARMIL3 #2 (0.97 ± 0.02, n=3 samples), CARMIL3 #3 (0.10 ± 0.01, n=3 samples), LPPR4 #3 (0.04 ± 0.00, n=6 samples), LRRC7 #3 (0.06 ± 0.01, n=3 samples), and LAP2 #1 (0.02 ± 0.01, n=3 samples). F8,41=85.192, p<0.0001. d Schematic depicting CRISPR depletion of candidates in cultured hippocampal neurons. e Representative images of dendritic morphology for each group of virally mediated depletions. Scale bars are 5 μm. f Graphical representation of dendritic protrusion density for each group of virally mediated depletions, Control (66 ± 2 protrusions, n=66 neurons), LAP2 (81 ± 2 protrusions, n=22 neurons), LPPR4 (66 ± 2 protrusions, n=27 neurons), LRRC7 (56 ± 2 protrusions, n=30 neurons), CARMIL3 (49 ± 3 protrusions, n=29 neurons). Error bars are standard error of the mean (SEM). F4,169=24.55, p<0.0001. *p<0.05, ***p<0.001; ****p<0.0001, one-way ANOVAs
Fig. 4
Fig. 4
CARMIL3 localization during synapse development. a Schematic depicting HITI labeling of endogenous CARMIL3 with myc or smFP. b Representative western blot of myc pulldown of endogenous CARMIL3 at P7, P14, P21, and P28. c Expression of endogenous CARMIL3 in the P14 mouse brain. CARMIL3 expression is most pronounced in the cortex (green—Cas9-2A-GFP, blue—DAPI). Scale bar is 900 μm. d Representative images of HITI-mediated mCherry (magenta) expression in the CA1 hippocampus. Scale bars are 25 μm. e Representative images of HITI-mediated mCherry (magenta) expression in the cortex. Scale bars are 25 μm. f Control image of AAV-HITI-smFP-P2A-mCherry expression in cultured hippocampal neurons without CARMIL3 sgRNA. Neurons were co-transfected with a GFP fluorescent fill (green) and infected with AAV-Cas9. Scale bar is 5 μm. g Knock-in expression of CARMIL3-smFP (gray) in cultured neurons using CARMIL3 sgRNA. CARMIL3 localizes along dendrites and dendritic protrusions in hippocampal neurons and neurons are marked with mCherry expression (blue) under the control of the endogenous CARMIL3 promoter. Neurons were also co-transfected with a GFP fill (green) and infected with AAV-Cas9. Scale bar is 5 μm. h IMARIS reconstruction of a dendritic section of a control hippocampal neuron. Dendrite is gray, protrusions are blue, and smFP is green. Scale bar is 5 μm. i IMARIS reconstruction of dendritic section of a CARMIL3-smFP KI neuron. Dendrite is gray, protrusions are blue, and CARMIL3-smFP is green. Scale bar is 5 μm
Fig. 5
Fig. 5
CARMIL3 depletion causes alterations in dendritic spine maturation. a Schematic of CRISPR-based depletion strategy of CARMIL3 in cultured hippocampal neurons. b Representative images of control (WT) and CARMIL3-depleted (MUT) neurons at DIV8. Scale bars are 5 μm. c Graphical representation of dendritic spine density for WT (18 ± 1 spines, n=28 neurons) and MUT (18 ± 2 spines, n=28 neurons) neurons at DIV8. p=0.8235. d Graphical representation of filopodia density for WT (14 ± 1 filopodia, n=28 neurons) and MUT (13 ± 1 protrusions, n=28 neurons) neurons at DIV8. p=0.4541. e Representative images of WT and MUT neurons at DIV16. Scale bars are 5 μm. f Graphical representation of dendritic spine density for WT (48 ± 2 spines, n=29 neurons) and MUT (24 ± 2 spines, n=29 neurons) neurons at DIV16. p<0.0001. g Graphical representation of dendritic filopodia density for WT (13 ± 1 filopodia, n=29 neurons) and MUT (25 ± 2 filopodia, n=29 neurons) neurons at DIV16. p<0.0001. h Schematic of HITI gene trap strategy utilized for depleting CARMIL3 in vivo. i Representative images of tdTomato fill in WT and MUT pyramidal neurons at postnatal day 14 (P14) in hippocampal CA1. Scale bars are 5 μm. j Graphical representation of dendritic protrusion density for WT (81 ± 5 protrusions, n=20 neurons) and MUT (62 ± 5 protrusions, n=11 neurons) neurons at P14. p=0.018. k Graphical representation of dendritic spine density for WT (74 ± 5 spines, n=20 neurons) and MUT (53 ± 6 spines, n=11 neurons) neurons at P14. p=0.018. l Graphical representation of dendritic filopodia density for WT (7 ± 1 filopodia, n=20 neurons) and MUT (9 ± 2 filopodia, n=11 neurons) neurons at P14. Error bars are standard error of the mean (SEM). p=0.272. *p<0.05, **p<0.01, ****p<0.0001, t-tests
Fig. 6
Fig. 6
CARMIL3 depletion results in functionally immature excitatory synapses. a Schematic of HITI gene trap method used to sparsely deplete CARMIL3 from cultured hippocampal neurons. Whole-cell patch clamp recordings were conducted from tdTomato-expressing cells on DIV12–16. b Representative traces of pharmacologically isolated AMPAR-mediated mEPSCs recorded from control (WT, blue) and CARMIL3-depleted (MUT, green) neurons. c Amplitude cumulative probability plots for AMPAR-mEPSCs. Quantification on the right shows average AMPAR-mEPSC amplitude for WT (13.92 ± 2.13 pA, n=17 neurons) and MUT (9.16 ± 0.64 pA, n=17 neurons) neurons. p=0.0454. d Interevent interval (IEI) cumulative probability plots for AMPAR-mEPSCs. Quantification on the right shows average AMPAR-mEPSC IEI for WT (49.96 ± 7.50 ms, n=17 neurons) and MUT (107.22 ± 18.62 ms, n=17 neurons) neurons. p=0.0095. e Schematic of method used to examine surface AMPAR levels in control and CARMIL3-depleted neurons. f Representative images of WT and MUT neurons at DIV12–16. tdTomato fill is magenta, and SEP-GluA1/2 is green. Scale bars are 2 μm. g Graphical representation of the ratio of SEP-GluA1/2 intensity in protrusions to dendritic shafts for WT (1.81 ± 0.16, n=19 neurons) and MUT (0.93 ± 0.05, n=23 neurons) neurons. p < 0.0001. h Graphical representation of the ratio of SEP-GluA1/2 intensity in protrusions to dendritic shafts specifically in spines (WT, 2.07 ± 0.59, n=19 neurons; MUT, 1.07 ± 0.32, n=23 neurons; p < 0.0001) and filipodia (WT, 0.79 ± 0.25, n = 19 neurons; MUT, 0.71 ± 0.14, n = 23 neurons; p=0.319). Error bars are standard error of the mean (SEM). *p < 0.05, **p < 0.01, ****p < 0.0001, t-tests
Fig. 7
Fig. 7
CARMIL3 interacts with both Wrp and capping protein in developing synapses. a Schematic depicting domains of CARMIL3. PH pleckstrin homology domain, LRR leucine-rich region, HD helical domain, CPB capping protein-binding domain, PRR proline-rich region. The beginning of the PRR also contains a region with homology to the Wrp-binding motif (WrpB) of WAVE1. b Pulldowns of HA epitope-tagged CARMIL3 or CARMIL3 with a deletion of the 8 amino acid Wrp-binding motif. CARMIL3, Wrp, and capping protein constructs were overexpressed in HEK293T cells. c Pulldowns of endogenous CARMIL3 with HITI epitope-tagged Myc on the c-terminus. Both Wrp and capping protein, but not ArpC3 co-IP with CARMIL3 in vivo in the mouse forebrain. d Schematic depicting CRISPR depletion of CARMIL3 in cultured hippocampal neurons. e Representative images of WT and MUT neurons at DIV16 stained for capping protein (green) and tdTomato fill (magenta). Scale bars are 5 μm. f Graphical representation of the percentage of dendritic protrusions with capping protein for WT (66 ± 3%, n=14 neurons) and MUT (57 ± 4%, n=14 neurons) neurons at DIV16. p=0.0473. g Graphical representation of the total amount of capping protein in WT (28823.00 ± 7271.45 a.u., n=14 neurons) and MUT (22943.41 ± 4640.35 a.u., n=14 neurons) dendrites at DIV16. Error bars are standard error of the mean (SEM). p=0.5026. *p<0.05, t-tests
Fig. 8
Fig. 8
Schematic of proposed CARMIL3 function during synapse development. (1) In the absence of CARMIL3 and capping protein, monomeric (G-actin) is preferentially added to the barbed (+) ends of filamentous actin (F-actin). (2) CARMIL3 bound to capping protein is recruited to the membrane of developing protrusions through its interaction with Wrp. (3) Capping protein binds to the barbed ends of actin filaments, preventing the addition of G-actin. (4) G-actin is now primed for nucleation by the Arp2/3 complex, which shifts the actin dynamics of the developing synapse from largely linear actin to a dense, branched actin network required for synaptic maturation

References

    1. Dailey ME, Smith SJ. The dynamics of dendritic structure in developing hippocampal slices. J. Neurosci. 1996;16:2983–2994. doi: 10.1523/JNEUROSCI.16-09-02983.1996. - DOI - PMC - PubMed
    1. Fiala JC, Feinberg M, Popov V, Harris KM. Synaptogenesis via dendritic filopodia in developing hippocampal area CA1. J. Neurosci. 1998;18:8900–8911. doi: 10.1523/JNEUROSCI.18-21-08900.1998. - DOI - PMC - PubMed
    1. Ziv NE, Smith SJ. Evidence for a role of dendritic filopodia in synaptogenesis and spine formation. Neuron. 1996;17:91–102. doi: 10.1016/S0896-6273(00)80283-4. - DOI - PubMed
    1. Cooper MW, Smith SJ. A real-time analysis of growth cone-target cell interactions during the formation of stable contacts between hippocampal neurons in culture. J. Neurobiol. 1992;23:814–828. doi: 10.1002/neu.480230704. - DOI - PubMed
    1. Spence EF, Kanak DJ, Carlson BR, Soderling SH. The Arp2/3 complex is essential for distinct stages of spine synapse maturation, including synapse unsilencing. J. Neurosci. 2016;36:9696–9709. doi: 10.1523/JNEUROSCI.0876-16.2016. - DOI - PMC - PubMed

Publication types

MeSH terms