. 2019 Jan 23;10(1):390.
doi: 10.1038/s41467-018-07931-2.

Single-cell RNA-seq denoising using a deep count autoencoder

Affiliations

Single-cell RNA-seq denoising using a deep count autoencoder

Gökcen Eraslan et al. Nat Commun. .

Abstract

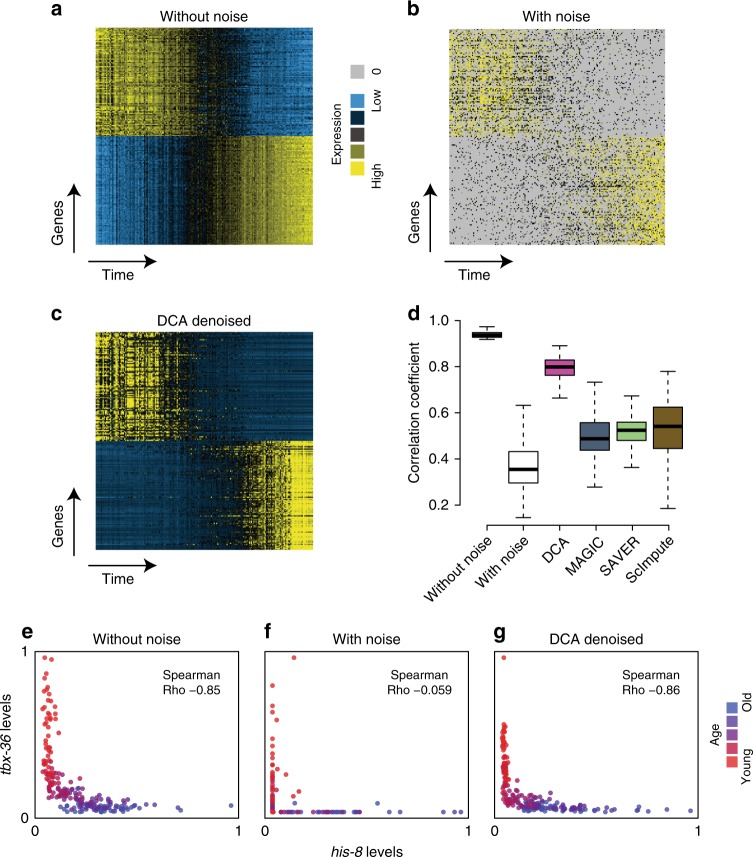
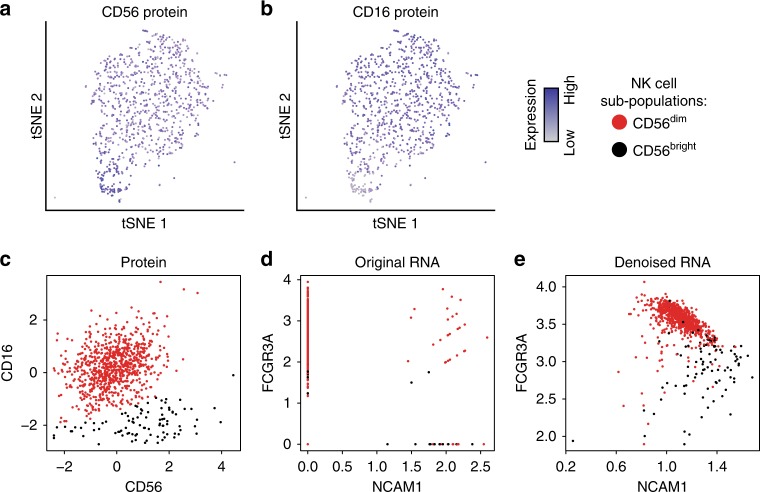
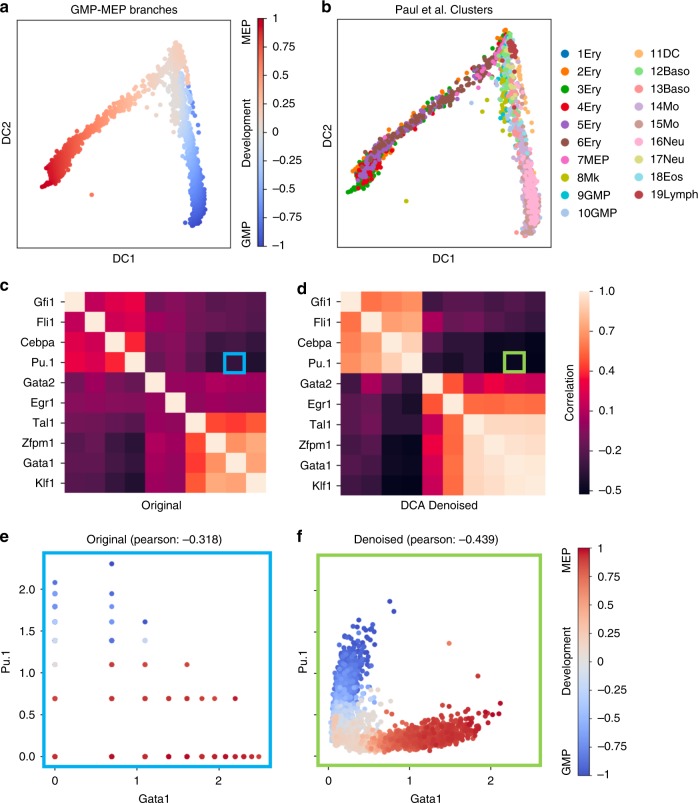
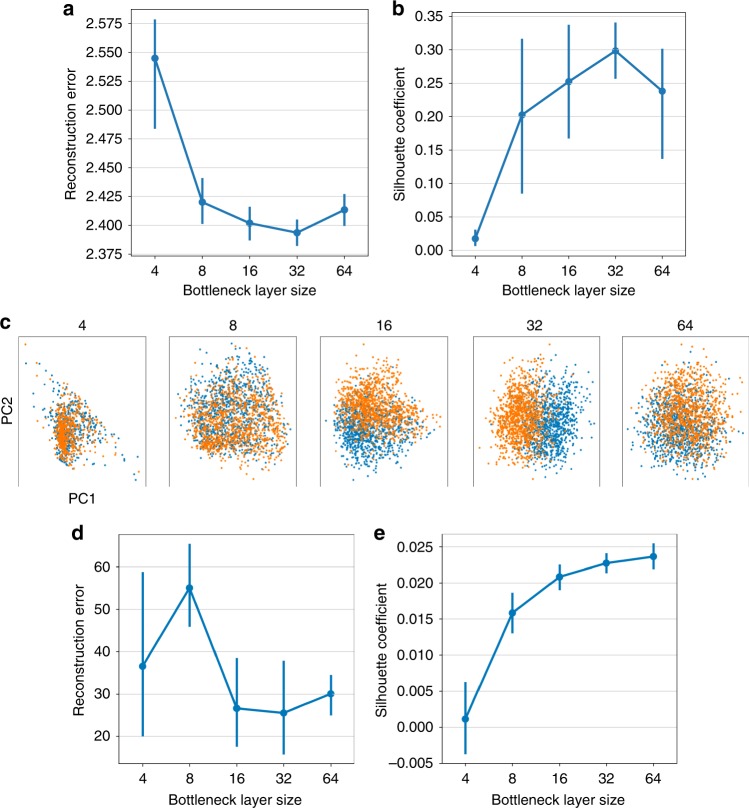
Single-cell RNA sequencing (scRNA-seq) has enabled researchers to study gene expression at a cellular resolution. However, noise due to amplification and dropout may obstruct analyses, so scalable denoising methods for increasingly large but sparse scRNA-seq data are needed. We propose a deep count autoencoder network (DCA) to denoise scRNA-seq datasets. DCA takes the count distribution, overdispersion and sparsity of the data into account using a negative binomial noise model with or without zero-inflation, and nonlinear gene-gene dependencies are captured. Our method scales linearly with the number of cells and can, therefore, be applied to datasets of millions of cells. We demonstrate that DCA denoising improves a diverse set of typical scRNA-seq data analyses using simulated and real datasets. DCA outperforms existing methods for data imputation in quality and speed, enhancing biological discovery.


Conflict of interest statement

The authors declare no competing interests.

Figures

Fig. 1
Fig. 1
DCA denoises scRNA-seq data by learning the underlying true zero-noise data manifold using an autoencoder framework. a Depicts a schematic of the denoising process adapted from Goodfellow et al.. Red arrows illustrate how a corruption process, i.e. measurement noise including dropout events, moves data points xj away from the data manifold (black line). The autoencoder is trained to denoise the data by mapping measurement-corrupted data points x~i back onto the data manifold (green arrows). Filled blue dots represent corrupted data points. Empty blue points represent the data points without noise. b Shows the autoencoder with a ZINB loss function. Input is the original count matrix (pink rectangle; gene by cells matrix, with dark blue indicating zero counts) with six genes (pink nodes) for illustration purposes. The blue nodes depict the mean of the negative binomial distribution which is the main output of the method representing denoised data, whereas the green and red nodes represent the other two parameters of the ZINB distribution, namely dispersion and dropout. Note that output nodes for mean, dispersion and dropout also consist of six genes which match six input genes. The matrix highlighted in blue shows the mean value for all cells which denotes the denoised expression. and the mean matrix of the negative binomial component represents the denoised output (blue rectangle). Input counts, mean, dispersion and dropout probabilities are denoted as x, μ, θ and π, respectively
Fig. 2
Fig. 2
Count-based loss function is necessary to identify celltypes in simulated data with high levels of dropout noise. a depicts plots of principal components 1 and 2 derived from simulated data without dropout, with dropout, with dropout denoised using DCA and MSE based autoencoder from left to right. Cells are colored by celltype. b shows heatmaps of the underlying gene expression data. c illustrates tSNE visualization of simulated scRNA-seq data with six cell types. Cells are colored by celltype. d shows heatmaps of the underlying gene expression data
Fig. 3
Fig. 3
DCA captures population structure in 68,579 peripheral blood mononuclear cells. a shows the tSNE visualization reproduced from Zheng et al.. b illustrates the activations from the two-dimensional bottleneck layer of the DCA. Colors represent celltype assignment from Zheng et al., where CD4 + and CD8 + cells are combined into coarse groups. Silhouette coefficients are −0.01 and 0.07 for tSNE and DCA visualizations. cf show two-dimensional bottleneck layer colored by the log-transformed expression of celltype marker genes CD8A (CD8 + T cells), CD14 (CD14 + Monocytes), NKG7 (CD56 + natural killer cells) and FCER1A (dendritic cells), respectively. DCA derived manifold robustly reconstructs continuous differentiation phenotype. g, h illustrate the activations from the two-dimensional bottleneck layer of DCA colored by celltype assignment from Paul et al. (g) and diffusion pseudotime (h), respectively. i shows the DPT as calculated using the standard DPT workflow and the two-dimensional bottleneck layer coordinates on the X and Y axis, respectively. Cells are colored by celltype assignment from Paul et al.. Abbreviations Ery, Mk, DC, Baso, Mo, Neu, Eos, Lymph correspond to erythrocytes, megakaryocytes, dendritic cells, basophils, monocytes, neutrophils, eosinophils and lymphoid cells, respectively
Fig. 4
Fig. 4
DCA recovers gene expression trajectories in C. elegans time course experiments with simulated dropout. Heatmaps show the top 100 genes with positive and negative association with time course using expression data without noise (a), with noise (b) and after DCA denoising (c). Yellow and blue colors represent relative high and low expression levels, respectively. Zero values are colored grey. Distribution of Pearson correlation coefficients across the 500 most highly correlated genes before noise addition for the various expression matrices are depicted in d. The box represents the interquartile range, the horizontal line in the box is the median, and the whiskers represent 1.5 times the interquartile range. Panels eg illustrate gene expression trajectory for exemplary anti-correlated gene pair tbx-36 and his-8 over time for data without, with noise and after denoising using DCA
Fig. 5
Fig. 5
DCA increases correspondence between single-cell and bulk differential expression analysis. Scatterplots depict the estimated log fold changes for each gene derived from differential expression analysis using bulk and original scRNA-seq count matrix (a), DCA denoised count matrix (b). Grey horizontal and vertical lines indicate zero log fold change. Black line indicates identity line. Points are colored by the absolute difference between log fold changes from bulk and single-cell data with red colors indicating relative high differences. ce depict differential expression of an exemplary gene LEFTY1 between H1 and DEC for the bulk, original and DCA denoised data, respectively. f illustrates boxplots of the distribution of Pearson correlation coefficients from bootstrapping differential expression analysis using 20 randomly selected cells from the H1 and DEC populations for all denoising methods
Fig. 6
Fig. 6
DCA increases protein and RNA co-expression. a depicts tSNE visualization of transcriptomic profiles of cord blood mononuclear cells from Stoeckius et al.. Cells are colored by major immunological celltypes. b contains tSNE visualizations colored by protein expression (first row), RNA expression derived from the original (second row) and DCA denoised data (third row). Columns correspond to CD3 (first column), CD11c (second column), CD56 (third column) proteins and corresponding RNAs CD3E, ITGAX and NCAM1. c shows the distribution of expression values for CD3 protein (blue), original (green) and DCA denoised (pink) CD3E RNA in T cells. Spearman correlation coefficients for the eight protein-RNA pairs across all cells for the original and denoised data are plotted in d
Fig. 7
Fig. 7
DCA scales linearly with the number of cells. Plot shows the runtimes for denoising of various matrices with different numbers of cells down-sampled from 1.3 million mouse brain cells. Colors indicate different methods. DCA (GPU) indicates the DCA method run on the GPU
Fig. 8
Fig. 8
Denoising enhances discovery of cellular phenotypes. tSNE visualization of transcriptomically derived NK cell cluster colored by CD56 (a) and CD16 (b) protein expression levels. Grey and blue indicate relative low and high expression, respectively. c shows CD56 and CD16 protein expression across NK cells, revealing two distinct sub-populations defined as CD56dim (red) and CD56bright (bright). d, e depict expression of corresponding RNAs NCAM1 and FCGR3A using the original count data and DCA denoised data, respectively. Cells are colored by protein expression derived assignment to CD56bright (black) and CD56dim (red) NK cell sub-populations
Fig. 9
Fig. 9
Denoising by DCA increases correlation structure of key regulatory genes. a, b display diffusion maps of blood development into GMP and MEP colored by developmental trajectory and celltype, respectively. Abbreviations Ery, Mk, DC, Baso, Mo, Neu, Eos, Lymph correspond to erythrocytes, megakaryocytes, dendritic cells, basophils, monocytes, neutrophils, eosinophils and lymphoid cells, respectively. c, d display heatmaps of correlation coefficients for well-known blood regulators taken from Krumsiek et al.. Highlighted areas show Pu.1 - Gata1 correlation in the heatmap. e, f show anti-correlated gene expression patterns of Gata1 and Pu.1 transcription factors colored by pseudotime, respectively
Fig. 10
Fig. 10
ReconstructionTraining error correlates with DCA performance and can guide hyperparameter selection. a, b show the distribution of the reconstructiontraining error and Silhouette coefficients across five different bottleneck layer sizes, respectively. Error bars represent standard error across five iterations. c shows exemplary PCA results derived from denoised expression data across the five bottleneck layer configurations. Colors represent simulated celltypes. d, e show the distribution of the reconstruction error and Silhouette coefficients when applying analogous analysis to the Zheng et al. data

References

    1. Keren-Shaul H, et al. A unique microglia type associated with restricting development of Alzheimer’s disease. Cell. 2017;169:1276–1290.e17. doi: 10.1016/j.cell.2017.05.018. - DOI - PubMed
    1. Stephenson W, et al. Single-cell RNA-seq of rheumatoid arthritis synovial tissue using low-cost microfluidic instrumentation. Nat. Commun. 2018;9:791. doi: 10.1038/s41467-017-02659-x. - DOI - PMC - PubMed
    1. Haghverdi L, Büttner M, Wolf FA, Buettner F, Theis FJ. Diffusion pseudotime robustly reconstructs lineage branching. Nat. Methods. 2016;13:845–848. doi: 10.1038/nmeth.3971. - DOI - PubMed
    1. Moignard V, et al. Decoding the regulatory network of early blood development from single-cell gene expression measurements. Nat. Biotechnol. 2015;33:269–276. doi: 10.1038/nbt.3154. - DOI - PMC - PubMed
    1. Herring CA, et al. Unsupervised trajectory analysis of single-cell rna-seq and imaging data reveals alternative tuft cell origins in the gut. Cell Syst. 2018;6:37–51.e9. doi: 10.1016/j.cels.2017.10.012. - DOI - PMC - PubMed

Publication types