. 2019 Jan 23;9(1):320.
doi: 10.1038/s41598-018-35685-w.

Using Baidu Search Engine to Monitor AIDS Epidemics Inform for Targeted intervention of HIV/AIDS in China

Affiliations

Using Baidu Search Engine to Monitor AIDS Epidemics Inform for Targeted intervention of HIV/AIDS in China

Kang Li et al. Sci Rep. .

Abstract

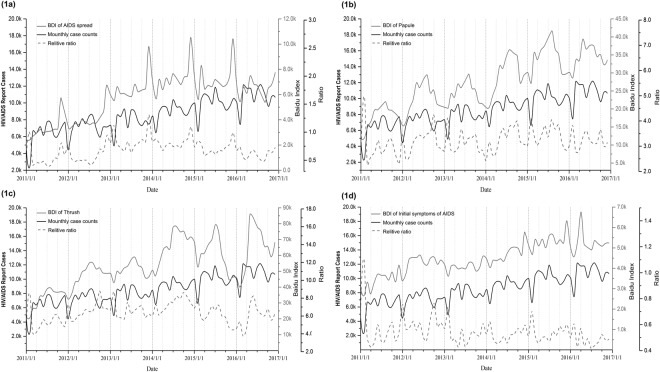
China's reported cases of Human Immunodeficiency Virus (HIV) and AIDS increased from over 50000 in 2011 to more than 130000 in 2017, while AIDS related search indices on Baidu from 2.1 million to 3.7 million in the same time periods. In China, people seek AIDS related knowledge from Baidu which one of the world's largest search engine. We study the relationship of national HIV surveillance data with the Baidu index (BDI) and use it to monitor AIDS epidemic and inform targeted intervention. After screening keywords and making index composition, we used seasonal autoregressive integrated moving average (ARIMA) modeling. The most correlated search engine query data was obtained by using ARIMA with external variables (ARIMAX) model for epidemic prediction. A significant correlation between monthly HIV/AIDS report cases and Baidu Composite Index (r = 0.845, P < 0.001) was observed using time series plot. Compared with the ARIMA model based on AIDS surveillance data, the ARIMAX model with Baidu Composite Index had the minimal an Akaike information criterion (AIC, 839.42) and the most exact prediction (MAPE of 6.11%). We showed that there are close correlations of the same trends between BDI and HIV/AIDS reports cases for both increasing and decreasing AIDS epidemic. Therefore, the Baidu search query data may be a good useful indicator for reliably monitoring and predicting HIV/AIDS epidemic in China.


Conflict of interest statement

The authors declare no competing interests.

Figures

Figure 1
Figure 1
Time series of Some Keywords Search Index and monthly reported cases for HIV/AIDS in China, 2011–2016. This picture shows the time-series comparison curve between the Baidu search index and the national monthly report case number for the four keywords “AIDS spread,” “pimple,” “thrush,” and “Initial symptoms of HIV”. (The X-axis date interval is month. The Y-axis uses three coordinates, which the black Y-axis shows the number of monthly report cases, the red Y axis is the Baidu search index of the keywords and the blue Y-axis is the ratio of the search index to the monthly report cases); BDI: Baidu Search index.
Figure 2
Figure 2
Time series of Baidu Composite Index in China from 2011 to 2016. This figure displays the three-dimensional changes in the year and month timescales of Baidu Composite Index from 1 January, 2011 and 31 December, 2016. (The X-axis date interval is month; the Y-axis time interval is year; the Z-axis is the national Baidu Composite Index (Baidu CI).
Figure 3
Figure 3
Comparisons of HIV/AIDS report cases and the five types of keywords in different provinces from 2011 to 2016. The column diagram shows the total number of HIV/AIDS report cases for six provinces; the line graph represents the five types of keywords total search index in each province.
Figure 4
Figure 4
Search intensity and annual case counts. This figure describes the changes in annual case counts and the Web users Search intensity in different provinces from 2011 to 2016. The line charts represent the annual HIV/AIDS case counts (black), and Baidu Search intensity (gray) for all of the six provinces. Pcc: Pearson Correlation Coefficient.
Figure 5
Figure 5
Autocorrelation check of residuals for the model, and the Interrelationships diagram of input sequence and output sequence. The X-axis gives the number of lags in weeks, the Y-axis is the value of the correlation coefficient, and the gray zone illustrate 95% confidence interval.

References

    1. Unaids. AIDS by the numbers. Unaids (2016).
    1. Cheng CK, et al. A profile of the online dissemination of national influenza surveillance data. Bmc Public Health. 2009;9:339. doi: 10.1186/1471-2458-9-339. - DOI - PMC - PubMed
    1. Azar, J. Electric Cars and Oil Prices. Social Science Electronic Publishing (2009).
    1. Goel S, Watts DJ. Predicting consumer behavior with Web search. Proceedings of the National Academy of Sciences of the United States of America. 2010;107:17486–17490. doi: 10.1073/pnas.1005962107. - DOI - PMC - PubMed
    1. Bordino I, et al. Web search queries can predict stock market volumes. Plos One. 2012;7:e40014. doi: 10.1371/journal.pone.0040014. - DOI - PMC - PubMed

Publication types