Meta-Analysis
. 2019 Jan 23;10(1):397.
doi: 10.1038/s41467-019-08301-2.

Comparative oncogenomics identifies combinations of driver genes and drug targets in BRCA1-mutated breast cancer

Affiliations
Meta-Analysis

Comparative oncogenomics identifies combinations of driver genes and drug targets in BRCA1-mutated breast cancer

Stefano Annunziato et al. Nat Commun. .

Abstract

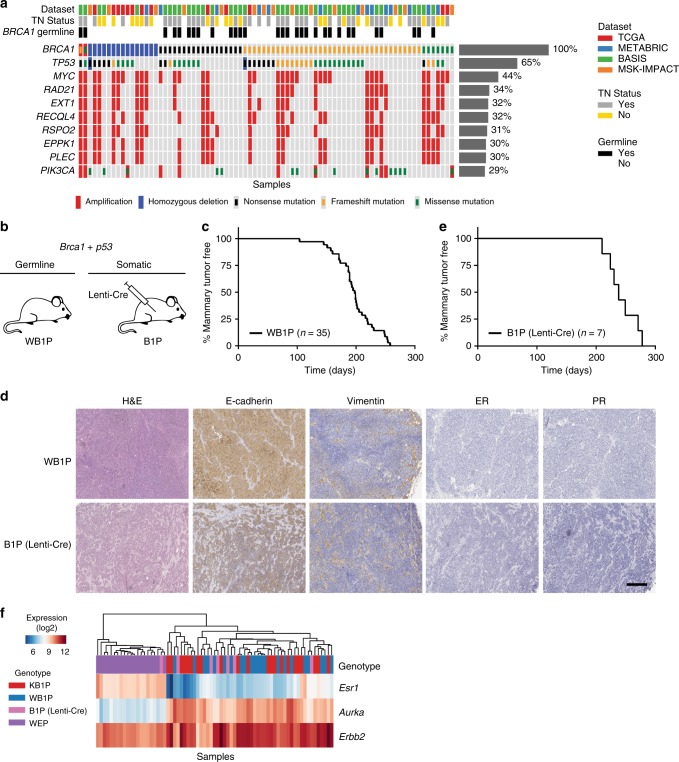
BRCA1-mutated breast cancer is primarily driven by DNA copy-number alterations (CNAs) containing large numbers of candidate driver genes. Validation of these candidates requires novel approaches for high-throughput in vivo perturbation of gene function. Here we develop genetically engineered mouse models (GEMMs) of BRCA1-deficient breast cancer that permit rapid introduction of putative drivers by either retargeting of GEMM-derived embryonic stem cells, lentivirus-mediated somatic overexpression or in situ CRISPR/Cas9-mediated gene disruption. We use these approaches to validate Myc, Met, Pten and Rb1 as bona fide drivers in BRCA1-associated mammary tumorigenesis. Iterative mouse modeling and comparative oncogenomics analysis show that MYC-overexpression strongly reshapes the CNA landscape of BRCA1-deficient mammary tumors and identify MCL1 as a collaborating driver in these tumors. Moreover, MCL1 inhibition potentiates the in vivo efficacy of PARP inhibition (PARPi), underscoring the therapeutic potential of this combination for treatment of BRCA1-mutated cancer patients with poor response to PARPi monotherapy.


Conflict of interest statement

The authors declare no competing interests.

Figures

Fig. 1
Fig. 1
Mutational landscape of human BRCA1-mutated TNBC and characterization of the WB1P model. a Overview of the most common deleterious mutations and copy-number events in 80 BRCA1-mutated human breast tumor samples from four large-scale tumor-sequencing studies. b Overview of the germline and somatic mouse models for mammary gland-specific inactivation of conditional Brca1 and Trp53 alleles. c Kaplan–Meier curve showing mammary tumor-specific survival for WapCre;Brca1F/F;Trp53F/F (WB1P) female mice. d Representative hematoxylin and eosin (HE) staining and immunohistochemical detection of E-cadherin, vimentin, ER and PR in WB1P tumors and in tumors from Lenti-Cre injected Brca1F/F;Trp53F/F (B1P) mice. Bar, 400 µm. e Kaplan–Meier curve showing mammary tumor-specific survival of B1P females injected with Lenti-Cre. f Unsupervised clustering (Euclidean distance, average linkage) of the WB1P tumors with tumors derived from published mouse models of luminal (WapCre;Cdh1F/F;PtenF/F, WEP; ref. ) and basal-like (K14Cre;Brca1F/F;Trp53F/F, KB1P; ref. ) breast cancer, using a three-genes signature that distinguishes the PAM50 subtypes
Fig. 2
Fig. 2
Validation of additional drivers in WB1P mice using germline and somatic engineering. a Overview of the germline and somatic mouse models for mammary gland-specific Myc overexpression in mice with conditional Brca1 and Trp53 alleles. b Kaplan–Meier curves showing mammary tumor-specific survival for the different genotypes. WapCre;Brca1F/F;Trp53F/F;Col1a1invCAG-Myc-IRES-Luc/+ (WB1P-Myc) females showed a reduced mammary tumor-specific survival compared to WB1P littermates (97 days vs. 198 days; ****P < 0.0001 by Mantel-Cox test). c Kaplan–Meier curves showing mammary tumor-specific survival for the different non-germline models. Brca1F/F;Trp53F/F;Col1a1invCAG-Myc-IRES-Luc/+ (B1P-Myc) females injected with Lenti-Cre, B1P females injected with Lenti-MycP2ACre and WB1P females injected with Lenti-Myc showed a reduced mammary tumor-specific survival compared to B1P female mice injected with Lenti-Cre (respectively 126, 92, and 61 days after injection vs. 238 days after injection; ****P < 0.0001 by Mantel-Cox test). d Representative hematoxylin and eosin (HE) staining and immunohistochemical detection of E-cadherin, vimentin, ER and PR in tumors from WB1P-Myc females and in tumors from Lenti-Cre injected B1P-Myc mice, Lenti-MycP2ACre injected B1P mice and Lenti-Myc injected WB1P mice. Bar, 400 µm. e Overview of the intraductal injections performed in WapCre;Brca1F/F;Trp53F/F;Col1a1invCAG-Cas9-IRES-Luc/+ (WB1P-Cas9) females with high-titer lentiviruses encoding Myc and either a non-targeting (NT) sgRNA (Lenti-sgNT-Myc), a sgRNA targeting exon 2 of Rb1 (Lenti-sgRb1-Myc) or a sgRNA targeting exon 7 of Pten. f Kaplan–Meier curves showing mammary tumor-specific survival for the different models. WB1P-Cas9 females injected with Lenti-sgPten-Myc and Lenti-sgRb1-Myc showed a reduced mammary tumor-specific survival compared to WB1P-Cas9 female mice injected with Lenti-sgNT-Myc (respectively 30 and 52 days after injection vs. 70 days after injection, ****P < 0.0001 and ***P < 0.001 by Mantel-Cox test). g Boxplots depicting the fraction of modified Rb1 and Pten alleles in tumors from WB1P-Cas9 mice injected with Lenti-sgNT-Myc, Lenti-sgRb1-Myc and Lenti-sgPten-Myc. Boxes extend from the third (Q3) to the first (Q1) quartile (interquartile range, IQR), with the line at the median; whiskers extend to Q3 + 1.5 × IQR and to Q1 − 1.5 × IQR
Fig. 3
Fig. 3
Identification of candidate drivers in WB1P-Myc tumors using comparative oncogenomics. a, b Genome-wide RUBIC analysis of CNV profiles of WB1P tumors (a) and WB1P-Myc tumors (b). Significant amplifications and deletions are marked by light red and blue columns, respectively. c Genomic instability of WB1P and WB1P-Myc tumors. Scores for spleen samples from WB1P mice are shown as reference; ****P < 0.0001 (two-sided Mann–Whitney U-test). Boxes extend from the third (Q3) to the first (Q1) quartile (interquartile range, IQR), with the line at the median; whiskers extend to Q3 + 1.5 × IQR and to Q1 − 1.5 × IQR. See Materials and Methods for more details. d Flowchart illustrating the comparative oncogenomics analysis pipeline used for the identification of additional cancer driver genes. e Chromosome 3 RUBIC analysis of the combined CNV profiles of the tumors from germline and somatic mouse models overexpressing Myc in the mammary gland. Significant amplifications are marked by light red columns. Genes residing in the minimal amplicon of chromosome 3 are shown. Cross-species candidate genes surviving filter criteria are colored in red. f Chromosome 1 RUBIC analysis of the CNV profiles of human TNBC. Significant amplifications are marked by light red columns. Orthologs of the genes shown in e are shown. Cross-species candidate genes surviving filter criteria are colored in red
Fig. 4
Fig. 4
Validation of MCL1 as a druggable driver in BRCA1-mutated TNBC. a MAGeCK software was used to compute RRA scores for all genes included in our focused shRNA library, showing depletion of Mcl1 shRNAs in WB1P-Myc organoids. b Immunohistochemical detection of MCL1 in multiple independent WB1P and WB1P-Myc tumors. Bar, 400 µm. c Overview of the non-germline mouse models for mammary-specific Mcl1 overexpression. d Kaplan–Meier curves showing mammary tumor-specific survival for the different models. B1P and B1P-Myc females injected with Lenti-Mcl1P2ACre showed a reduced mammary tumor-specific survival compared to B1P and B1P-Myc female mice injected with Lenti-Cre, respectively (180 days after injection vs 238 days after injection; **P < 0.01 by Mantel-Cox test; 70 days after injection vs 126 days after injection; ****P < 0.0001 by Mantel-Cox test). e In vitro response of WB1P and WB1P-Myc organoids to MCL1 inhibitor S63845. Error bars represent standard error of the mean. Experiment was performed in triplicate. f In vivo response of organoid-derived WB1P and WB1P-Myc tumors to S63845, as visualized by Kaplan–Meier curves. WB1P and WB1P-Myc organoid lines were transplanted in the fourth mammary fat pad of nude mice. When tumors had reached a size of 100 mm3, mice were treated with 25 mg kg-1 S63845 (i.v. once-weekly for 5 weeks) or vehicle. g Response of the BRCA1-mutated TNBC PDX-110 xenograft model to S63845 and the PARP inhibitor olaparib, as visualized by tumor volume curves (left) and Kaplan–Meier curves (right). Single-cell suspensions of PDX-110 were transplanted in the fourth mammary fat pad of NOD-SCID-IL2Rγc–/– mice. When tumors had reached a size of 100 mm3, mice were treated with 25 mg kg−1 S63845 (i.v. once-weekly for 4 weeks), 50 mg kg−1 olaparib (i.p. 5 days out of 7 for 4 weeks), both drugs or vehicle. Combination therapy with S63845 and olaparib prolonged survival compared to olaparib monotherapy (****P < 0.0001 by Mantel-Cox test). Error bars represent standard error of the mean

References

    1. Ciriello G, et al. Emerging landscape of oncogenic signatures across human cancers. Nat. Genet. 2013;45:1127–1133. doi: 10.1038/ng.2762. - DOI - PMC - PubMed
    1. Cancer Genome Atlas N. Comprehensive molecular portraits of human breast tumours. Nature. 2012;490:61–70. doi: 10.1038/nature11412. - DOI - PMC - PubMed
    1. Beroukhim R, et al. Assessing the significance of chromosomal aberrations in cancer: methodology and application to glioma. Proc. Natl Acad. Sci. USA. 2007;104:20007–20012. doi: 10.1073/pnas.0710052104. - DOI - PMC - PubMed
    1. Klijn C, et al. Identification of cancer genes using a statistical framework for multiexperiment analysis of nondiscretized array CGH data. Nucleic Acids Res. 2008;36:e13. doi: 10.1093/nar/gkm1143. - DOI - PMC - PubMed
    1. van Dyk E, Reinders MJ, Wessels LF. A scale-space method for detecting recurrent DNA copy number changes with analytical false discovery rate control. Nucleic Acids Res. 2013;41:e100. doi: 10.1093/nar/gkt155. - DOI - PMC - PubMed

Publication types

MeSH terms

Substances