. 2019 Jan 23;9(1):431.
doi: 10.1038/s41598-018-36527-5.

Mechanisms and immunogenicity of nsPEF-induced cell death in B16F10 melanoma tumors

Affiliations

Mechanisms and immunogenicity of nsPEF-induced cell death in B16F10 melanoma tumors

Alessandra Rossi et al. Sci Rep. .

Abstract

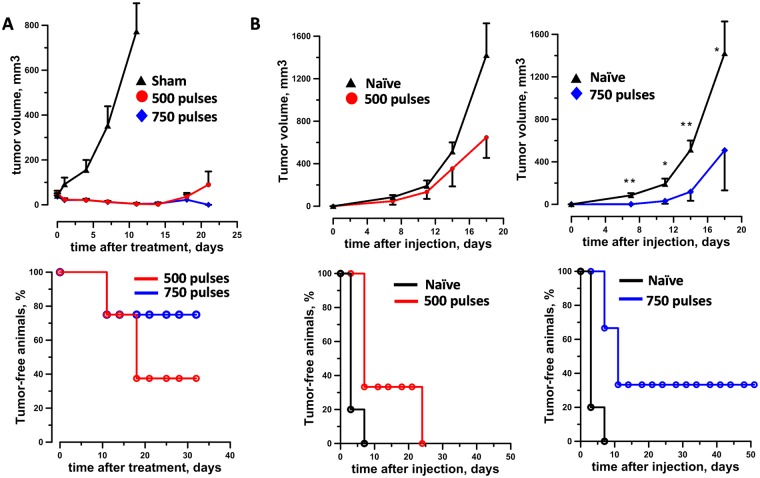
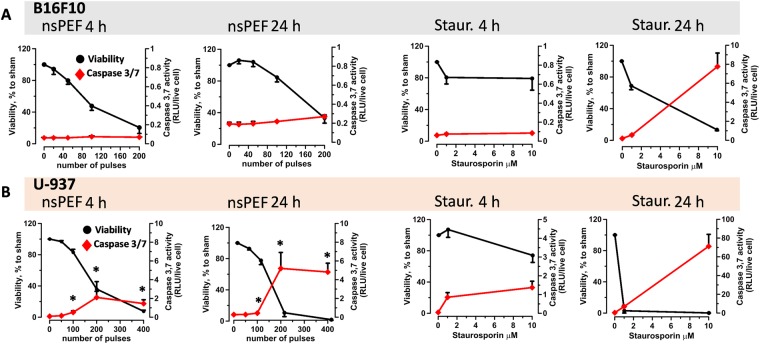
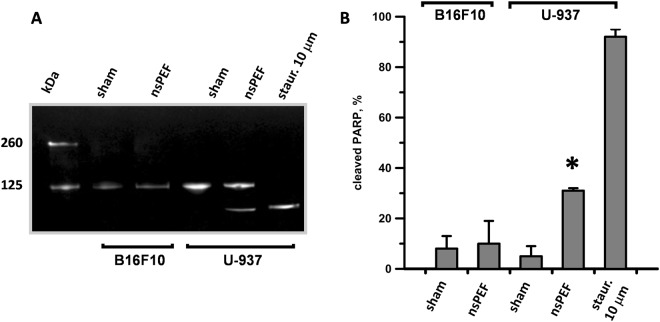
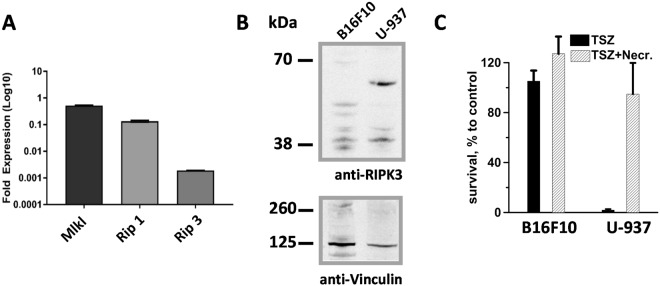
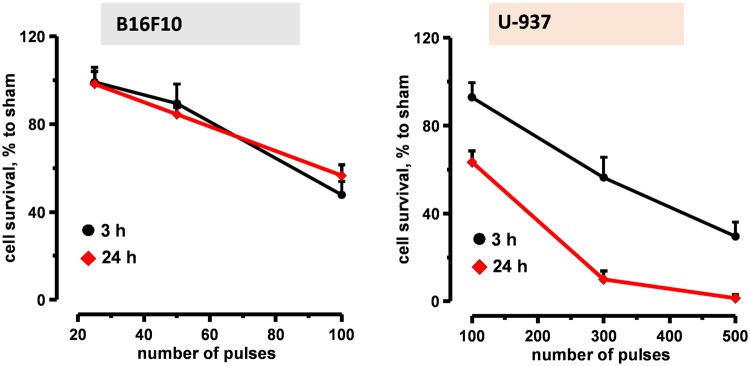
Accumulating data indicates that some cancer treatments can restore anticancer immunosurveillance through the induction of tumor immunogenic cell death (ICD). Nanosecond pulsed electric fields (nsPEF) have been shown to efficiently ablate melanoma tumors. In this study we investigated the mechanisms and immunogenicity of nsPEF-induced cell death in B16F10 melanoma tumors. Our data show that in vitro nsPEF (20-200, 200-ns pulses, 7 kV/cm, 2 Hz) caused a rapid dose-dependent cell death which was not accompanied by caspase activation or PARP cleavage. The lack of nsPEF-induced apoptosis was confirmed in vivo in B16F10 tumors. NsPEF also failed to trigger ICD-linked responses such as necroptosis and autophagy. Our results point at necrosis as the primary mechanism of cell death induced by nsPEF in B16F10 cells. We finally compared the antitumor immunity in animals treated with nsPEF (750, 200-ns, 25 kV/cm, 2 Hz) with animals were tumors were surgically removed. Compared to the naïve group where all animals developed tumors, nsPEF and surgery protected 33% (6/18) and 28.6% (4/14) of the animals, respectively. Our data suggest that, under our experimental conditions, the local ablation by nsPEF restored but did not boost the natural antitumor immunity which stays dormant in the tumor-bearing host.


Conflict of interest statement

The authors declare no competing interests.

Figures

Figure 1
Figure 1
Ablation and protective antitumor immune response induced by nsPEF in B16F10 melanoma model. Mice bearing 40–50 mm3 B16F10 tumors were treated with either 500 or 750, 200-ns pulses (25 kV/cm, 2 Hz) or left untreated (sham control). At 7 weeks post nsPEF, animals that experienced complete tumor remission were challenged with tumor cells and monitored for the appearance of palpable tumors. An age matched naïve group was used as a control for tumor growth. Panels A and B show the tumor growth curves (top graphs) and % of tumor free animals (bottom graphs) after nsPEF (A) and tumor challenge (B), respectively. Mean ± s.e., n = 8 for sham, 500 and 750 pulses (A). Mean ± s.e., n = 10 and n = 3 for naïve and 500 pulses, respectively (B, left graphs). Mean ± s.e., n = 10 and n = 6 for naïve and 750 pulses, respectively (B, right graphs). *p < 0.05, ** p < 0.01 for the difference between 750 pulses and naïve groups.
Figure 2
Figure 2
Histological analysis of nsPEF treated tumors. 30–50 mm3 B16F10 tumors were treated with 750, 200-ns pulses (25 kV/cm, 2 Hz) or left untreated (sham control). Panel A shows H&E pictures for one sham and one nsPEF-treated tumor collected at 4 h post treatment. In (B), both anti-cleaved caspase 3 (green) and -Ki-67 (red) immunofluorescence were performed to assess apoptosis and cell proliferation, respectively. Panel B shows representative images from three sham (top) and three nsPEF (bottom) -treated tumors. Panel C shows a positive control for the anti-cleaved Caspase 3 staining, namely HeLa cells treated with 1 μm staurosporin for 5 h. Scale bar: 1000 μm or 100 μm (inset) (A); 100 μm (B,C).
Figure 3
Figure 3
nsPEF triggers apoptotic cell death in U-937 but not in B16F10 cells. B16F10 (A) and U-937 (B) cells were either exposed in cuvettes to increasing numbers of 200-ns pulses (7 kV/cm, 10 Hz) or treated with staurosporine. Both cell viability (Presto blue assay) and Caspase 3/7 activation (Caspase-Glo 3/7 assay) were measured at 4 and 24 hours post treatment. In each plot the left y-axis refers to cell vibility expressed in %-to sham exposed parallel control (shown in black) while the right y-axis is the caspase activity expressed in relative luminescence units (RLU) per live cell (shown in red). Mean +/− s.e. n = 3–5. *p < 0.05 for caspase activity of nsPEF from sham.
Figure 4
Figure 4
nsPEF induce PARP cleavage in U937 but not in B16F10. B16F10 and U-937 cell suspensions were exposed to 100 pulses (200-ns, 7 kV/cm, 10 Hz) or left untreated (sham). Protein extracts collected 6 hours after treatment were analyzed by western blot for full length (116 kDa) and cleaved PARP (89 kDa). Panel A shows a representative Western blot and (B) the quantification of the PARP cleaved fraction. Staurosporine (10 µM) treated U937 were used as a positive control. Blot image has been cropped, full-length blot is presented in Supplementary Figure 1. Mean +/− s.e. n = 3. *p < 0.01 for the difference between sham and nsPEF-treated U-937.
Figure 5
Figure 5
Necroptotic machinery expression analysis and response to necroptotic stimuli: B16F10 vs. U937 cells. In panel A the expression levels of Mlkl, Rip1 and Rip3 genes in B16F10 cells were measured by real-time quantitative PCR. Each gene mRNA level was normalized to the housekeeping Hprt gene mRNA and is shown as relative expression. (B) Protein extracts from B16F10 and U-937 were analyzed by western blot for RIP3 and, as control, Vinculin expression. RIP3 (57 kDa) is expressed in U-937 but not in B16F10 lysates. Blot images have been cropped, full-length blots are presented in Supplementary Figure 1. (C) B16F10 and U-937 cells were treated with TSZ (25 ng/ml TNF alpha, 1 µM Smac mimetic and 40 μM zVAD). To block necroptosis we used 60 μm Necrostatin. Cell survival was measured at 24 h post treatment by MTT assay. Mean +/− s.e. n = 3 (A,C).
Figure 6
Figure 6
Time course of nsPEF induced cell death in both B16F10 and U-937 cells. Both B16F10 (left panel) and U-937 (right panel) were exposed to increasing number of 200-ns pulses (7 kV/cm, 10 Hz). Viability was measured at 3 and 24 h post treatment by Presto blue assay and expressed in %-to sham exposed parallel control. Mean +/− s.e. n = 5.
Figure 7
Figure 7
Effect of 200-ns pulses on B16F10 autophagy. A LC3/GFP stable B16F10 cell line was generated by transient transfection with a LC3/GFP construct and selection with G418. In (A) protein extracts from B16F10 and LC3/GFP B16F10 cells were analyzed by western blot for LC3 expression. LC3-GFP fusion protein is seen as a 50 kDa band. Blot image has been cropped, full-length blot is presented in Supplementary Figure 1. Panel B shows representative images from LC3/GFP B16F10 (control) and cells treated for 4 h with 1 μg/ml Rapamycin to induce autophagy and 25 μm Chloroquine to block LC3-GFP lysosome degradation. Scale bar: 10 μm. In (C) LC3/GFP B16F10 cells were exposed to either 50 or 100, 200-ns pulses (7 kV/cm, 10 Hz). As a positive control for autophagy induction cells were treated with rapamycin (1 μg/ml). The GFP mean fluorescence intensity was measured by flow cytometry at 2, 6 and 24 hours after treatment. Sham-exposed negative controls are shown in grey in all panels. (D) Shows the quantification of the effect seen in (C) Mean +/− s.e. for n = 3. *p < 0.01 for the effect of 50, 100 pulses and rapamycin vs. sham control.
Figure 8
Figure 8
Antitumor immune response in nsPEF vs. surgery treated mice. 40–50 mm3 B16F10 tumors were either treated with nsPEF (750, 200-ns pulses, 25 kV/cm at 2 Hz) or surgically removed. At 7 weeks after treatments, animals that experienced complete tumor remission were challenged with tumor cells and monitored for the appearance of palpable tumors. An age matched naïve group was used as a control for tumor growth. Panel A shows the tumor growth curves and (B) the % of tumor free animals. Mean +/− s.e., n = 20, 18, and 14 for naïve, nsPEF and surgery groups, respectively. *p < 0.05 for the difference of nsPEF from naïve.
Figure 9
Figure 9
nsPEF exposure setup to treat mice tumors. (A) Pulse generator. (B) Plate pinch electrode with two round stainless steel plates (1) 8 mm in diameter and a spacer of 4 mm between the plates (2). (C) Representative waveform (200 ns) at 10 kV.

References

    1. Kroemer G, Galluzzi L, Kepp O, Zitvogel L. Immunogenic cell death in cancer therapy. Annu Rev Immunol. 2013;31:51–72. doi: 10.1146/annurev-immunol-032712-100008. - DOI - PubMed
    1. Gamrekelashvili J, et al. Primary sterile necrotic cells fail to cross-prime CD8(+) T cells. Oncoimmunology. 2012;1:1017–1026. doi: 10.4161/onci.21098. - DOI - PMC - PubMed
    1. Scheffer SR, et al. Apoptotic, but not necrotic, tumor cell vaccines induce a potent immune response in vivo. Int J Cancer. 2003;103:205–211. doi: 10.1002/ijc.10777. - DOI - PubMed
    1. Casares N, et al. Caspase-dependent immunogenicity of doxorubicin-induced tumor cell death. J Exp Med. 2005;202:1691–1701. doi: 10.1084/jem.20050915. - DOI - PMC - PubMed
    1. Yang H, et al. Contribution of RIP3 and MLKL to immunogenic cell death signaling in cancer chemotherapy. Oncoimmunology. 2016;5:e1149673. doi: 10.1080/2162402X.2016.1149673. - DOI - PMC - PubMed

Publication types