. 2019 Jan 23;9(1):421.
doi: 10.1038/s41598-018-36844-9.

The E3 ubiquitin ligase Itch is required for B-cell development

Affiliations

The E3 ubiquitin ligase Itch is required for B-cell development

Xiaoling Liu et al. Sci Rep. .

Abstract

The E3 ubiquitin ligase Itch interacts with Foxo1 and targets it for ubiquitination and degradation during follicular helper T-cell differentiation, whereas the transcription factor Foxo1 plays a critical role in B-cell development. Thus, we proposed that Itch mediates B-cell differentiation. Unexpectedly, we found that Itch deficiency downregulated Foxo1 expression in B cells. Itch cKO (conditional knock out in B cells) mice had fewer pro-B cells in the bone marrow, more small resting IgM-IgD-B cells in the periphery, and lower B-cell numbers in the lymph nodes through decreased Foxo1-mediated IL-7Rα, RAG, and CD62L expression, respectively. Importantly, Itch deficiency reduced Foxo1 mRNA expression by up-regulating JunB-mediated miR-182. Finally, Foxo1 negatively regulated JunB expression by up-regulating Itch. Thus, we have identified a novel regulatory axis between Itch and Foxo1 in B cells, suggesting that Itch is essential for B-cell development.


Conflict of interest statement

The authors declare no competing interests.

Figures

Figure 1
Figure 1
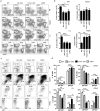
Itch is essential for B-cell development. Representative flow cytometry (FACS) profiles (a) and the absolute numbers (b) of CD3+B220 and CD3B220+ B cells and representative flow cytometry profiles (c) and the absolute numbers (d) of IgM+IgD+B cells and IgMIgDB-cells in gated CD3B220+ B cells in bone marrow (BM), spleen, lymph nodes (LNs), and peripheral blood monocytes (PBMCs) from Itch cKO mice and WT littermates (n = 12 per group, 7~9 weeks old). (b,d) two-way ANOVA plus Bonferroni post-tests to compare each column with control column. Error bars, s.e.m. *P < 0.05, **P < 0.01.
Figure 2
Figure 2
Similar abnormal B-cell development in both Itch cKO and Foxo1 cKO mice. Representative FACS profiles (a) and the absolute numbers (b) of CD3+B220 and CD3B220+ B cells and representative flow cytometry profiles (c) and the absolute numbers (d) of IgM+IgD+B cells and IgMIgDB-cells in gated CD3B220+ B cells in BM, spleen, LNs, and PBMCs from CD19creItchF/+Foxo1F/+ (WT), CD19creItchF/FFoxo1F/+ (Itch cKO), CD19creItchF/+Foxo1F/F (Foxo1 cKO), and CD19creItchF/FFoxo1F/F mice (Itch-Foxo1 cDKO) (n = 20 mice per group, 7~9 weeks old). One-way (b) and two-way (d) ANOVA plus Bonferroni post-tests to compare each column with control column. Error bars, s.e.m. *P < 0.05, **P < 0.01, ***P < 0.001.
Figure 3
Figure 3
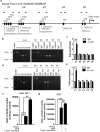
Itch deficiency blocks B-cell development by reducing Foxo1 expression. Immunoblot analysis of Itch and Foxo1 in splenic B cells (a), and RAG1 in pro-B cells (b) sorted from Itch cKO mice and WT littermates (n = 3 mice per group, 7~9 weeks old). Representative FACS profile indicating the expression of IL-7Rα in pro-B cells of BM (c) and CD62L in IgM+IgD+B cells (e) from WT, Itch cKO, Foxo1 cKO, and Itch and Foxo1 cDK mice (n = 4 mice per group, 7~9 weeks old). Immunoblot analysis of IL-7Rα expression in pro-B cells of BM (d) and CD62L expression in IgM+IgD+B cells of PBMC (f) sorted from Itch cKO mice and WT littermates (n = 3 mice per group, 7~9 weeks old). (g) Immunoassay of B220+ B cells sorted from 7–9 week-old Itch cKO mice and WT littermates (n = 3 mice per group, 7~9 weeks old), pretreated with MG132 and stimulated for 20 min with LPS (20 μg/ml), as assessed by denaturation of lysates in 1% SDS, immunoprecipitation with anti-ubiquitin (α-Ub) and immunoblot analysis with monoclonal anti-ubiquitin (P4D1; top blot) or anti-Foxo1 (bottom blot); lysates without immunoprecipitation (middle blot) probed with anti-Foxo1. (h) Real-time quantitative PCR (qPCR) analysis of Foxo1 mRNA in splenic B cells from WT and Itch cKO mice (n = 10 mice per group, 7~9 weeks old). Data are shown as fold-change relative to the expression in WT cells (arbitrarily set to 1), after normalization to GAPDH expression. (a–h) Results represent at least three independent experiments. (h) Two-tailed student’s t-test. Error bars, s.e.m. **P < 0.01.
Figure 4
Figure 4
Itch deficiency reduces Foxo1 mRNA expression by up-regulating JunB expression. (a) Splenic B cells from 7~9-week-old C57BL/6 mice were subjected to immunoprecipitation with anti-Itch antibodies (αItch) and isotype control IgG and immunoblotting with antibodies that were reactive to the indicated proteins. (b) Immunoassay of B220+ B cells sorted from 7~9-week-old Itch cKO mice and WT littermates (n = 3 mice per group, 7~9 weeks old), pretreated with MG132 and stimulated for 20 min with LPS (20 μg/ml), as assessed by denaturation of lysates in 1% SDS, immunoprecipitation with anti-ubiquitin (α-Ub) and immunoblot analysis with monoclonal anti-ubiquitin (P4D1; left blot) or anti-JunB (right lower blot); lysates without immunoprecipitation (right top blot) probed with anti-JunB. (c) Immunoblot analysis of Itch and JunB in splenic B cells sorted from 7~9-week-old Itch cKO mice and WT littermates (n = 3 mice per group, 7~9 weeks old). (d,e) Splenic B cells sorted from 7~9-week-old C57BL/6 mice were infected with lentivirus containing negative control (NC) shRNA or JunB-specific shRNA and stimulated for 48 hours with LPS (1 μg/ml). The expression of JunB and Foxo1 protein (d), and Foxo1 mRNA (e) was analyzed by immunoblotting and qPCR, respectively. (f,g) Splenic B cells sorted from 7~9-week-old Itch cKO mice and WT littermates (n = 3 mice per group, 7~9 weeks old) were infected with lentivirus containing negative control (NC) shRNA or JunB-specific shRNA and stimulated for 48 hours with LPS (1 μg/ml). The expression of Foxo1 protein (f) and mRNA (g) was analyzed by immunoblotting and qPCR, respectively. (e,g) Relative mRNA levels are normalized to GAPDH mRNA expression and calculated relative to the mRNA expression in WT cells infected with NC shRNA, set to 1. (a–g) Results represent at least three independent experiments. Two-tailed student’s t-test (e) and one-way ANOVA plus Bonferroni post-tests (g) to compare each column with control column. Error bars, s.e.m. *P < 0.05, **P < 0.01, ***P < 0.001.
Figure 5
Figure 5
JunB promotes activation of the Foxo1 promoter. (a) Schematic diagram of mouse Foxo1 promoter region illustrating the positions of the primer pairs used for ChIP assays. Sequences represent the main predicted JunB binding sites from Supplementary Tables I and II. Arrows represent the region of the 5 primer pairs. ChIP assays of WT B220+ B cells using a JunB (αJunB) (b,c) and c-Fos (αc-Fos) (d,e) antibody or control IgG probing for the Foxo1 promoter locus. PCR (b,d) and qPCR (c,d) were used to analyze the enrichment and the fold-enrichments are representative of one of four independent experiments. (c,e) Data are shown as fold-change relative to IgG control (arbitrarily set to 1), after normalization to input. Empty vector Lv 201 (Vector) or Lv201/JunB (JunB) and luciferase reporter vector pEZX-PG04.1/Foxo1 promoter were co-transduced into RAW264.7 cells (f) or 293 T cells (g). Dual luciferase reporter gene expression was analyzed, and the results are shown as the ratio of firefly to Renilla luciferase activity. (a–g) The data represent at least three independent experiments. Two-tailed student’s t-test (c,e) and one-way ANOVA plus Bonferroni post-tests (f,g) to compare each column with control column. Error bars, s.e.m. **p < 0.01, ***p < 0.001.
Figure 6
Figure 6
JunB reduces Foxo1 mRNA by up-regulating miR-182. (a) Real-time qPCR analysis of miR-182 in B cells from 7~9-week-old Itch cKO mice and WT littermates (n = 3 mice per group, 7~9 weeks old). Relative mRNA levels are normalized to GAPDH mRNA expression and calculated relative to the mRNA expression seen in WT cells, set to 1. (b) B cells from 7~9-week-old Itch cKO mice were infected with lentivirus containing negative control (NC) shRNA or JunB-specific shRNA and stimulated with LPS (1 μg/ml). On Day 3, the expression of JunB mRNA and miR-182 was analyzed by qPCR. Relative mRNA levels are normalized to GAPDH mRNA expression and calculated relative to the mRNA expression in NC shRNA-infected cells, set to 1. (c) Schematic diagram of mouse miR-182 promoter region illustrating the positions of the primer pairs used for ChIP assays. Sequences represent main predicted JunB binding sites from Supplementary Tables III and IV. Arrows represent the region of the 2 primer pairs. ChIP assays of WT B220+ B cells using a JunB antibody or control IgG probing for the miR-182 promoter locus. PCR (d) and qPCR using the p1 (e) and p2 (f) primer pairs were used to analyze the enrichment, and the fold-enrichments are representative of one of four independent experiments. (g,h) B cells from 7~9-week-old C57BL/6 mice were stimulated with LPS (1 μg/ml) and transduced with miR-182 mimics and inhibitor. On Day 3, the expression of Foxo1 mRNA (g) and protein (h) was analyzed by qPCR and immunoblotting, respectively. NC: negative control. (g) Relative mRNA levels are normalized to GAPDH mRNA expression and calculated relative to the mRNA expression in NC-treated cells, set to 1. (h) Band intensities of Foxo1 and GAPDH were quantified using ImageProPlus 5.0 software. The density ratios of Foxo1 to GAPDH compared with the NC group (set as 1) are shown as mean ± SEM (n = 3) of three independent experiments (right panel). (a–h) The data represent at least three independent experiments. Two-tailed student’s t-test (a,b,e,f) and two-way ANOVA plus Bonferroni post-tests (g) to compare each column with control column. Error bars, s.e.m. *p < 0.05, **p < 0.01.
Figure 7
Figure 7
Foxo1 negatively regulates JunB expression by promoting activation of the Itch promoter. (a) Immunoblot analysis of Foxo1, Itch, c-Jun, JunB, c-Fos, Notch2, and STAT3 in splenic IgM+IgD+B cells sorted from 7~9-week-old Itch cKO mice and WT littermates (n = 3 mice per group, 7~9 weeks old). (b) Schematic diagram of mouse Itch promoter region illustrating the positions of the primer pairs used for ChIP assays. Sequences represent the main predicted Foxo1 binding sites from Supplementary Tables V and VI. Arrows represent the region of the 7 primer pairs. (c,d) ChIP assays of WT B220+ B cells using a Foxo1 (αFoxo1) antibody or control IgG probing for the Foxo1 promoter locus. PCR (c) and qPCR (d) were used to analyze the enrichment and the fold-enrichments are representative of one of four independent experiments. (e,f) Empty vector Lv 201 (Vector) or Lv201/Foxo1 (Foxo1) and luciferase reporter vector pEZX-PG04.1/Itch promoter were co-transduced into RAW264.7 cells (e) or 293 T cells (f). Dual luciferase reporter gene expression was analyzed, and the results are shown as the ratio of firefly to Renilla luciferase activity. (g) Immunoblot analysis of Itch and Foxo1 in lv201 or Foxo1-expressing lv201 lentivirus-infected B cells from 7~9-week-old WT mice. (a–g) The data represent at least three independent experiments. Two-tailed student’s t-test (e,f) and two-way ANOVA plus Bonferroni post-tests (d) to compare each column with control column. Error bars, s.e.m. *p < 0.05, ***p < 0.001, ****p < 0.0001.

Similar articles

Cited by

References

    1. Pieper K, Grimbacher B, Eibel H. B-cell biology and development. J. Allergy Clin. Immunol. 2013;131:959–971. doi: 10.1016/j.jaci.2013.01.046. - DOI - PubMed
    1. Abolhassani H, Parvaneh N, Rezaei N, Hammarstrom L, Aghamohammadi A. Genetic defects in B-cell development and their clinical consequences. J. Investig. Allergol. Clin. Immunol. 2014;24:6–22. - PubMed
    1. Conley ME. Early defects in B cell development. Curr. Opin. Allergy Clin. Immunol. 2002;2:517–522. doi: 10.1097/00130832-200212000-00007. - DOI - PubMed
    1. Jiang XX, et al. Control of B cell development by the histone H2A deubiquitinase MYSM1. Immunity. 2011;35:883–896. doi: 10.1016/j.immuni.2011.11.010. - DOI - PMC - PubMed
    1. Clark MR, Mandal M, Ochiai K, Singh H. Orchestrating B cell lymphopoiesis through interplay of IL-7 receptor and pre-B cell receptor signalling. Nat. Rev. Immunol. 2014;14:69–80. doi: 10.1038/nri3570. - DOI - PMC - PubMed

Publication types

MeSH terms