

Lipid Uptake by Alveolar Macrophages Drives Fibrotic Responses to Silica Dust
- PMID: 30674959
- PMCID: PMC6344530
- DOI: 10.1038/s41598-018-36875-2
Lipid Uptake by Alveolar Macrophages Drives Fibrotic Responses to Silica Dust
Abstract
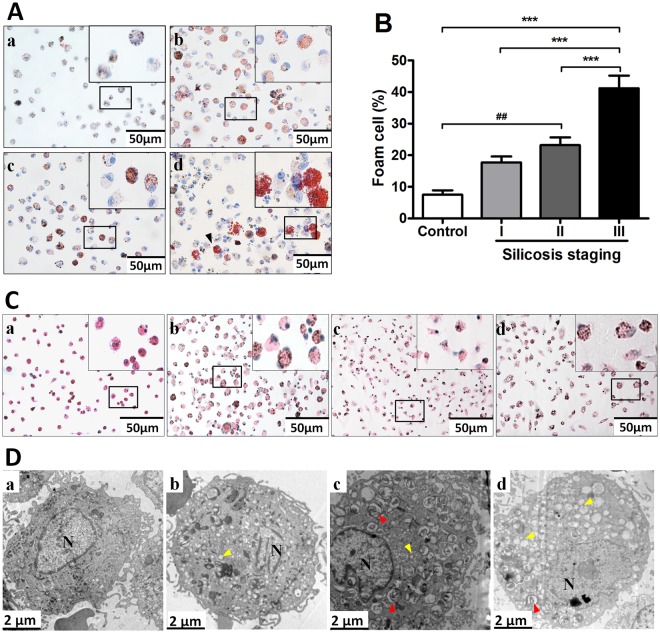
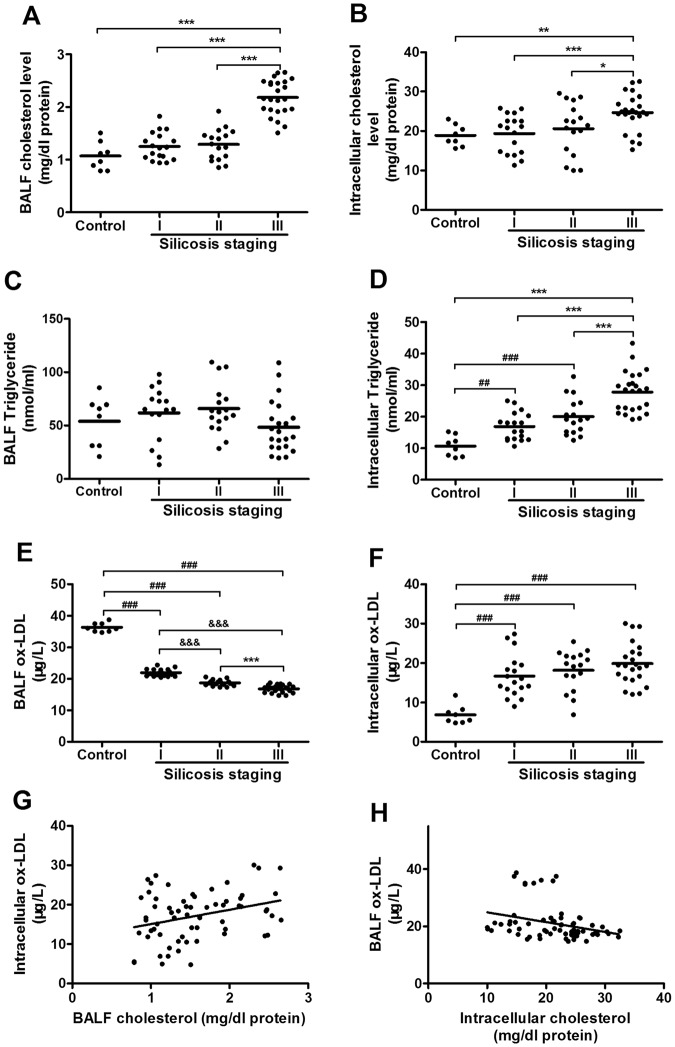
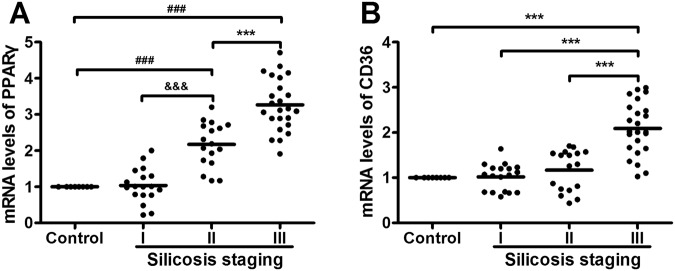
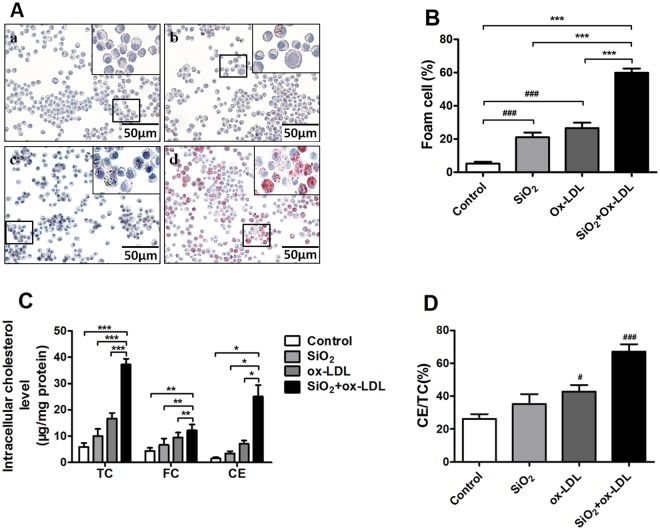
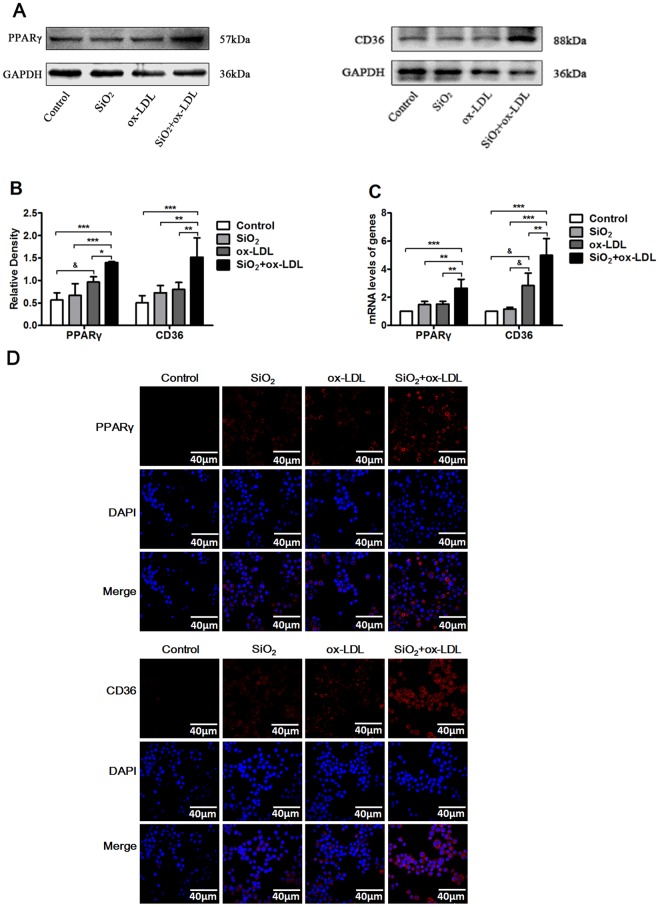
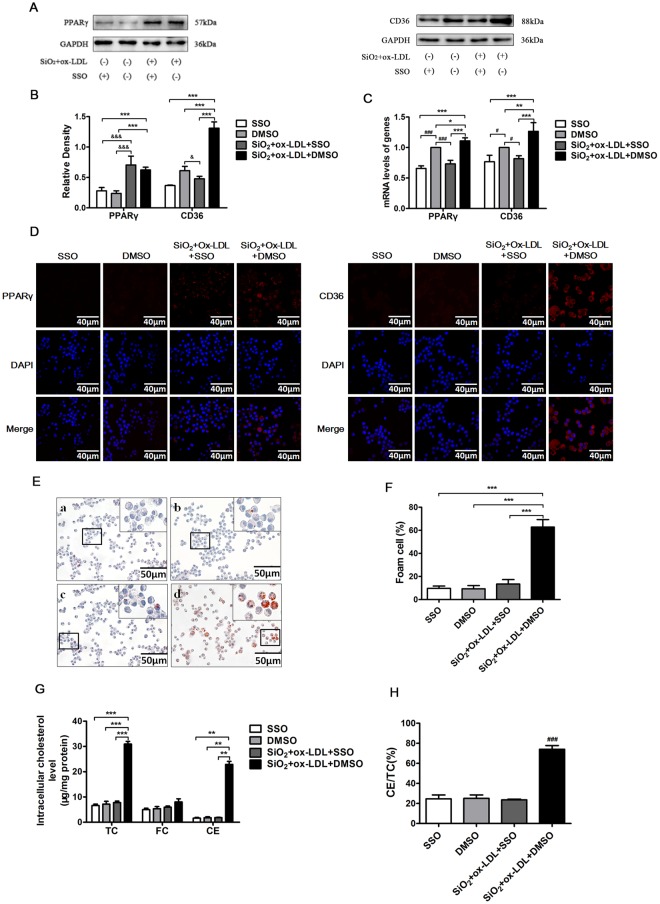
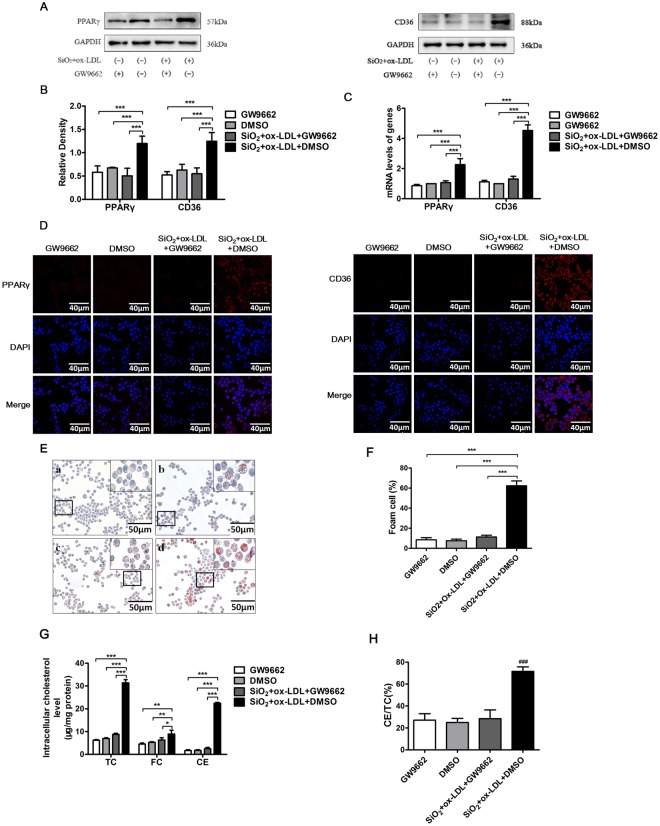
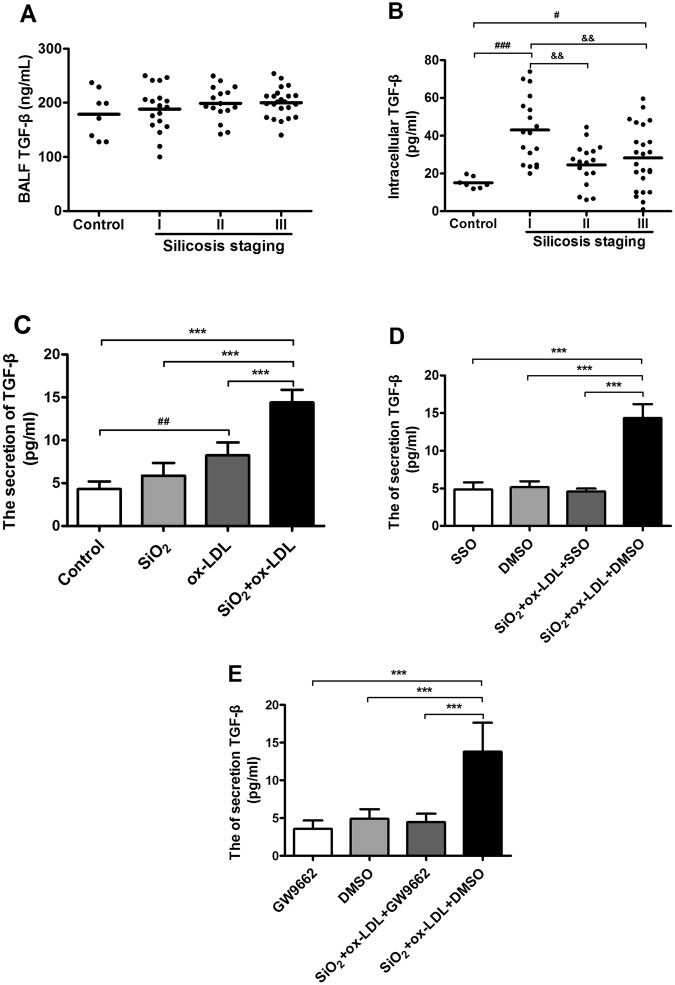
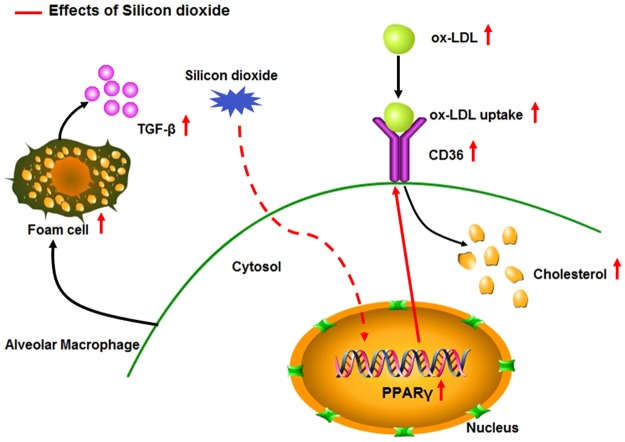
Silicosis is a common occupational disease and represents a significant contributor to respiratory morbidity and mortality worldwide. Lipid-laden macrophages, or foam cells, are observed in the lungs of patients with silicosis but the mechanisms mediating their formation remain poorly understood. In this study, we sought to elucidate the mechanisms by which silica promotes foam cell formation in the lung, and to determine whether uptake of lipids alone is sufficient to drive TGF-β production by alveolar macrophages. Consistent with previous reports, we found that foam cells were markedly increased in the lungs of patients with silicosis and that these findings associated with both higher levels of intracellular lipid levels (oxidized LDL, ox-LDL) and elevated transcript levels for the lipid scavenger receptor CD36 and the nuclear receptor PPARγ. Employing a rat alveolar macrophage cell line, we found that exposure to silica dust or ox-LDL alone had a modest effect on the induction of foam cell formation and only silica was capable of inducing the production of TGF-β. In contrast, foam cell formation and TGF-β production were both dramatically increased when cells were exposed to a combination of silica dust and ox-LDL. Moreover, we found that these endpoints were markedly attenuated by either blocking CD36 or inhibiting the activity of PPARγ. Altogether, our findings suggest that foam cell formation and TGF-β production are driven by the simultaneous uptake of silica and lipids in alveolar macrophages and that strategies aimed at blocking lipid uptake by alveolar macrophages might be effective in ameliorating fibrotic responses to silica in the lung.
Conflict of interest statement
The authors declare no competing interests.
Figures
Similar articles
-
A pneumocyte-macrophage paracrine lipid axis drives the lung toward fibrosis.Am J Respir Cell Mol Biol. 2015 Jul;53(1):74-86. doi: 10.1165/rcmb.2014-0343OC. Am J Respir Cell Mol Biol. 2015. PMID: 25409201 Free PMC article.
-
Silica-induced ROS in alveolar macrophages and its role on the formation of pulmonary fibrosis via polarizing macrophages into M2 phenotype: a review.Toxicol Mech Methods. 2025 Feb;35(2):89-100. doi: 10.1080/15376516.2024.2400323. Epub 2024 Sep 10. Toxicol Mech Methods. 2025. PMID: 39223849 Review.
-
ALDH2 deficiency inhibits Ox-LDL induced foam cell formation via suppressing CD36 expression.Biochem Biophys Res Commun. 2019 Apr 23;512(1):41-48. doi: 10.1016/j.bbrc.2019.02.012. Epub 2019 Mar 8. Biochem Biophys Res Commun. 2019. PMID: 30853183
-
Silica dust exposure induces autophagy in alveolar macrophages through switching Beclin1 affinity from Bcl-2 to PIK3C3.Environ Toxicol. 2020 Jul;35(7):758-767. doi: 10.1002/tox.22910. Epub 2020 Feb 15. Environ Toxicol. 2020. PMID: 32061152
-
Foam cells in atherosclerosis.Clin Chim Acta. 2013 Sep 23;424:245-52. doi: 10.1016/j.cca.2013.06.006. Epub 2013 Jun 16. Clin Chim Acta. 2013. PMID: 23782937 Review.
Cited by
-
Characterization of prostate macrophage heterogeneity, foam cell markers, and CXCL17 upregulation in a mouse model of steroid hormone imbalance.Sci Rep. 2024 Sep 9;14(1):21029. doi: 10.1038/s41598-024-71137-4. Sci Rep. 2024. PMID: 39251671 Free PMC article.
-
Macrophage Polarization and Functions in Pathogenesis of Chronic Obstructive Pulmonary Disease.Int J Mol Sci. 2024 May 22;25(11):5631. doi: 10.3390/ijms25115631. Int J Mol Sci. 2024. PMID: 38891820 Free PMC article. Review.
-
Molecular and Cellular Mechanisms of Electronegative Lipoproteins in Cardiovascular Diseases.Biomedicines. 2020 Nov 29;8(12):550. doi: 10.3390/biomedicines8120550. Biomedicines. 2020. PMID: 33260304 Free PMC article. Review.
-
Silicosis: from pathogenesis to therapeutics.Front Pharmacol. 2025 Jan 29;16:1516200. doi: 10.3389/fphar.2025.1516200. eCollection 2025. Front Pharmacol. 2025. PMID: 39944632 Free PMC article. Review.
-
Role of metabolic reprogramming in pro-inflammatory cytokine secretion from LPS or silica-activated macrophages.Front Immunol. 2022 Oct 21;13:936167. doi: 10.3389/fimmu.2022.936167. eCollection 2022. Front Immunol. 2022. PMID: 36341426 Free PMC article. Review.
References
Publication types
MeSH terms
Substances
LinkOut - more resources
Full Text Sources
Molecular Biology Databases
