. 2019 Jan 23;9(1):346.
doi: 10.1038/s41598-018-36922-y.

Proliferation-related changes in K+ content in human mesenchymal stem cells

Affiliations

Proliferation-related changes in K+ content in human mesenchymal stem cells

Irina Marakhova et al. Sci Rep. .

Abstract

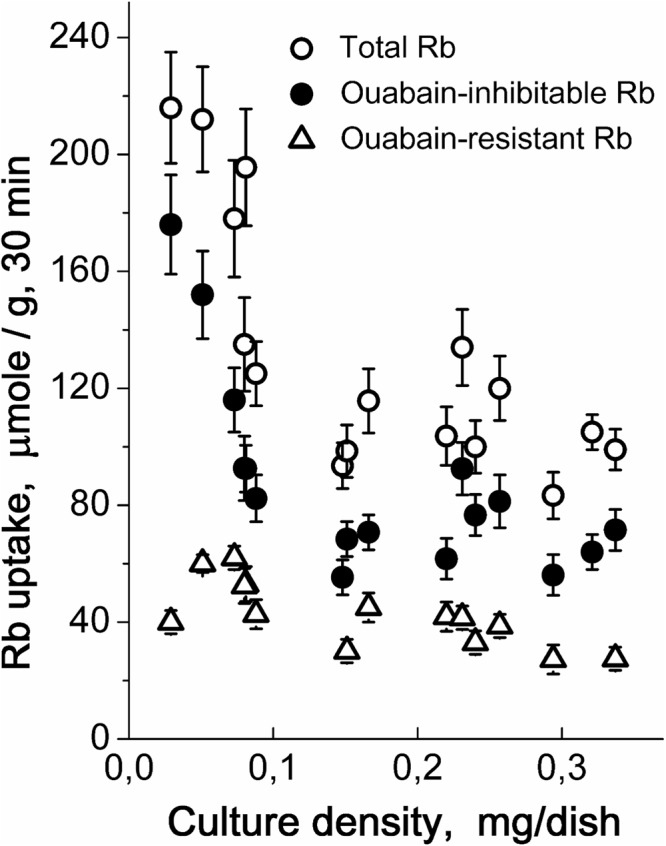
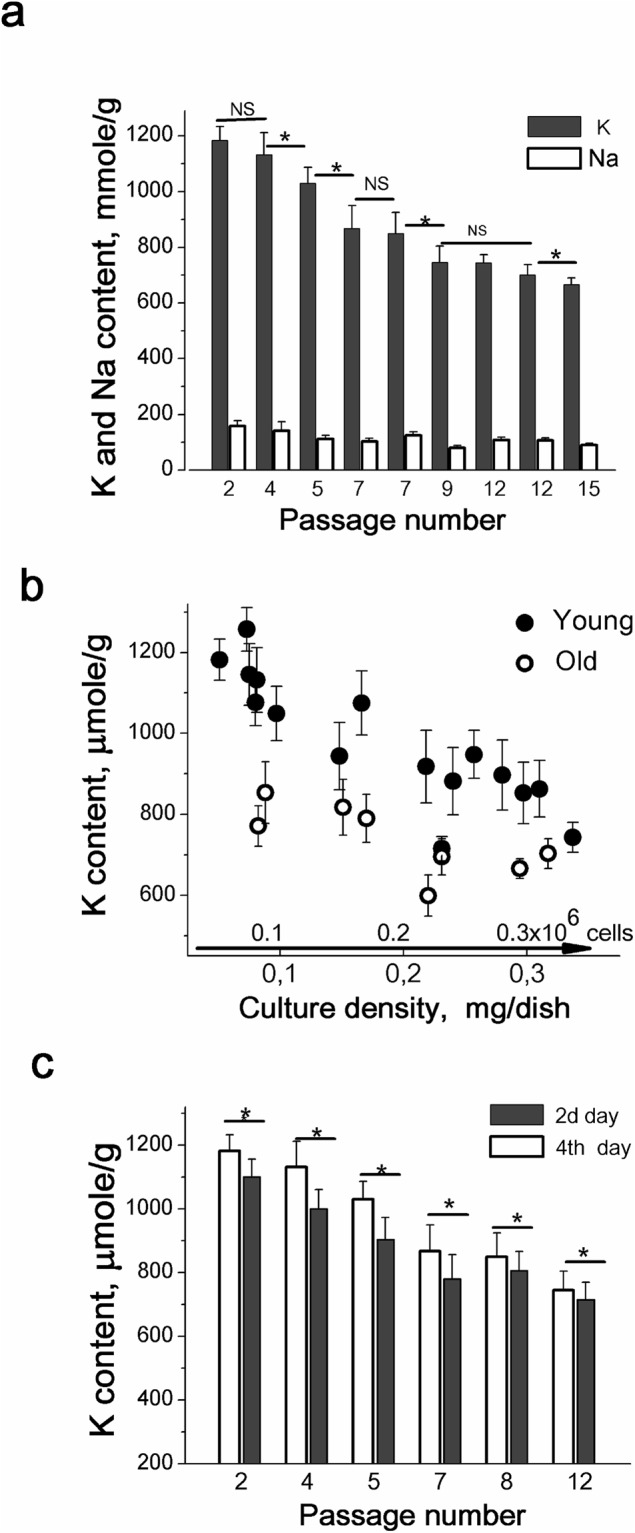
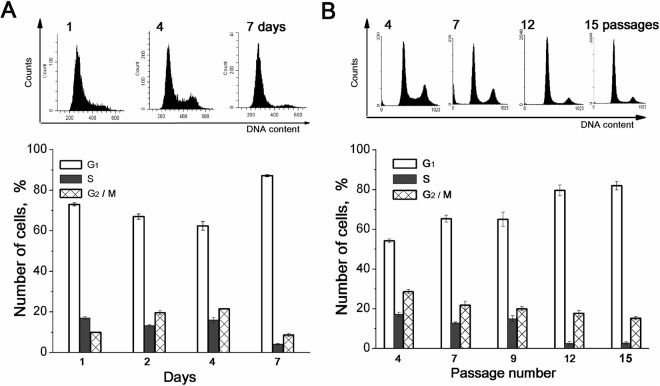
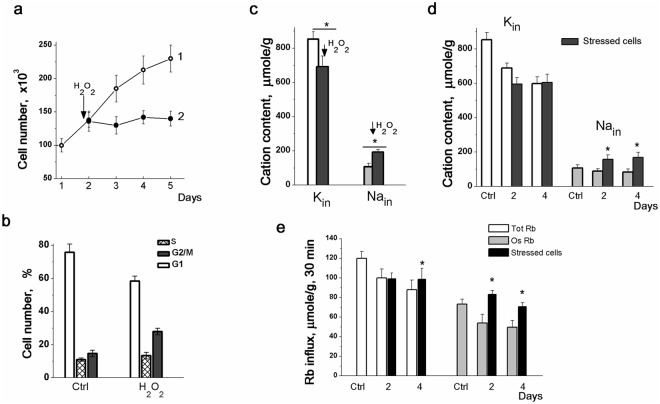
Intracellular monovalent ions have been shown to be important for cell proliferation, however, mechanisms through which ions regulate cell proliferation is not well understood. Ion transporters may be implicated in the intracellular signaling: Na+ and Cl- participate in regulation of intracellular pH, transmembrane potential, Ca2+ homeostasis. Recently, it is has been suggested that K+ may be involved in "the pluripotency signaling network". Our study has been focused on the relations between K+ transport and stem cell proliferation. We compared monovalent cation transport in human mesenchymal stem cells (hMSCs) at different passages and at low and high densities of culture as well as during stress-induced cell cycle arrest and revealed a decline in K+ content per cell protein which was associated with accumulation of G1 cells in population and accompanied cell proliferation slowing. It is suggested that cell K+ may be important for successful cell proliferation as the main intracellular ion that participates in regulation of cell volume during cell cycle progression. It is proposed that cell K+ content as related to cell protein is a physiological marker of stem cell proliferation and may be used as an informative test for assessing the functional status of stem cells in vitro.


Conflict of interest statement

The authors declare no competing interests.

Figures

Figure 1
Figure 1
Density-dependent changes in intracellular K+ and Na+ content during the growth of hMSCs culture. (a) Growth curve (1) and cell protein content (2) in cultivated hMSCs. A representative data of seven independent experiments are presented. (b) Changes in intracellular K+ and Na+ content per cell protein during the growth of hMSCs culture. The same experiment as in (a). (c) Increased culture density impact on K+ content in hMSCs. hMSCs (passage #2) were seeded simultaneously at two densities (5 × 104 and 15 × 104 cells per 35 mm dish), and at the third day, the intracellular cations were estimated. Data are representative of three independent experiments. (d) Cell K+ content decreased with increasing cell density in culture. Summary data from thirteen independent experiments are presented. The experimental conditions are similar to those in (a) and (b). The culture density is presented as cell protein per 35 mm dish with hMSCs culture. Bar graphs indicate the mean ± SD, n = 3–4. *p < 0.05 by Tukey t-test for each pair of columns. NS, not significant.
Figure 2
Figure 2
Rb+ influx in hMSCs is dependent on the cell density in culture. Rb+ influxes were defined in one experiment for three cultures of the same passage. Open circles: total Rb+ uptake; filled circles: ouabain-inhibitable Rb+ influx; triangles: ouabain-resistant leakage. The experimental conditions are similar to those presented in Fig. 1b. Every point represents the mean ± SD, n = 3–5. Summary data of thirteen independent experiments.
Figure 3
Figure 3
Intracellular K+ content is dependent on the passage number of hMSCs. (a) Cell K+ content per cell protein is decreased in the late-passaged hMSCs. Filled bars: cell K+ content, open bars: cell Na+ content. The data are presented as mean ± SD, n = 3. p < 0.05 by Tukey t-test for each pair of columns. NS, not significant. (b) Density-associated decrease in cell K+ content in early-passage (filled circles) and in late-passage (open circles) hMSCs. Summary data of eleven independent experiments are presented. Every point corresponds to cell K+ content determined in one experiment for cultures of the same passage. The data are presented as mean ± SD of three individual cultures of the same passage. (c) Density-associated decrease in cell K+ content is more significant in early-passage hMSCs as compared to late-passage hMSCs. Open bars: K+ contents in sparse cultures (at the second day); filled bars: K+ contents in confluent cultures (at the fourth day). All data are presented as mean ± SD, n = 3, *p < 0.05 by Tukey t-test for each pair of columns.
Figure 4
Figure 4
Cell proliferation rate is decreased both in the high density and in the late passage hMSCs cultures. (a) Cell cycle profile of hMSCs growing during seven days in culture. FASC assay (upper panel) and the percentage of cells in G1, S and (G2 + M) phases (low panel). A representative data of one experiment from five performed on the same scheme. (b) Cell cycle profile of hMSCs is dependent of the passage number. FACS assays (upper panel) of cultures at the third day after plating and the percentage of cells in G1, S and (G2 + M) phases (low panel). A representative data of nine experiments performed on the same scheme. All data are presented as mean ± SD of three individual cultures.
Figure 5
Figure 5
TEA effects on growth, cation content and proliferation of hMSCs. A representative data of two experiments performed on the same scheme. (a) Growth curves of control hMSCs (1, open circles) and hMSCs treated with 10 mM TEA (2, filled circles). (b) Cell cycle profiles of hMSCs growing four days in complete culture medium or in the presence of 10 mM TEA. (c) and (d) Effect of 10 mM TEA on cell K+ and Na+ content (c) and ouabain-resistent Rb+ influx (d). Light bars: untreated cells; gray bars: TEA-treated cells. (e) TEA increases the number of cells at G1 phase. The data are presented as mean ± SD (n = 3), *p < 0.05 by Tukey t-test, versus untreated cells. Ctrl: untreated cells.
Figure 6
Figure 6
Changes in K+ and Na+ content and Rb+ influxes in hMSCs and H2O2-induced cell cycle arrest. (a) Growth curves of control (1, open circles) and H2O2-treated (2, filled circles) hMSCs. A representative data of four experiments performed on the same scheme. (b) H2O2-treated hMSCs exhibited cell cycle arrest in G2/M phases. Cell cycle profile of hMSCs growing four days after H2O2 pulse under normal culture conditions is presented. Ctrl: untreated cells. (c) Changes in K+ and Na+ content in H2O2-treated hMSCs. An arrow indicates the H2O2 “pulse” (200 μM H2O2 for 0.5 h). Light (Kin) and light grey (Nain) bars: untreated cells; black bars: H2O2-treated cells. Data are presented as mean ± SD, n = 3, *p < 0.05 by Tukey t-test in each bar graph. (d) H2O2-induced cell cycle arrest is accompanied by persistently elevated Na+ content and did not affect K+ content in hMSCs. Light (Kin) and light gray (Nain) bars: untreated cells; black bars – after H2O2 “pulse” cells were cultivated under normal conditions for the indicated days. Ctrl: untreated cells. (e) Changes in Rb+ influxes in H2O2-treated hMSCs. Light bars: total Rb+ uptake; light gray bars: ouabain-sensitive Rb+ influx, black bars: H2O2-treated cells. The data are presented as mean ± SD (n = 3), *p < 0.05 by Tukey t-test, versus unstressed cells. Ctrl: untreated cells.

Similar articles

Cited by

References

    1. Baksh D, et al. Adult mesenchymal stem cells: characterization, differentiation, and application in cell and gene therapy. J. Cell. Mol. Med. 2004;8:301–316. doi: 10.1111/j.1582-4934.2004.tb00320.x. - DOI - PMC - PubMed
    1. Grompe M. Tissue stem cells: new tools and functional diversity. Cell Stem Cell. 2012;10:685–689. doi: 10.1016/j.stem.2012.04.006. - DOI - PMC - PubMed
    1. Nombela-Arrieta C, et al. The elusive nature and function of mesenchymal stem cells. Nat. Rev. Mol. Cell Biol. 2011;12:126–131. doi: 10.1038/nrm3049. - DOI - PMC - PubMed
    1. Wang S, et al. Clinical applications of mesenchymal stem cells. J. Hematol. Oncol. 2012;5:19–27. doi: 10.1186/1756-8722-5-19. - DOI - PMC - PubMed
    1. Grinstein S, Dixon SJ. Ion transport, membrane potential and cytoplasmic pH in lymphocytes: changes during activation. Physiol. Rev. 1989;69:417–481. doi: 10.1152/physrev.1989.69.2.417. - DOI - PubMed

Publication types