. 2019 Feb;566(7745):538-542.
doi: 10.1038/s41586-018-0842-3. Epub 2019 Jan 23.

Dynamics of oligodendrocyte generation in multiple sclerosis

Affiliations

Dynamics of oligodendrocyte generation in multiple sclerosis

Maggie S Y Yeung et al. Nature. 2019 Feb.

Erratum in

Abstract

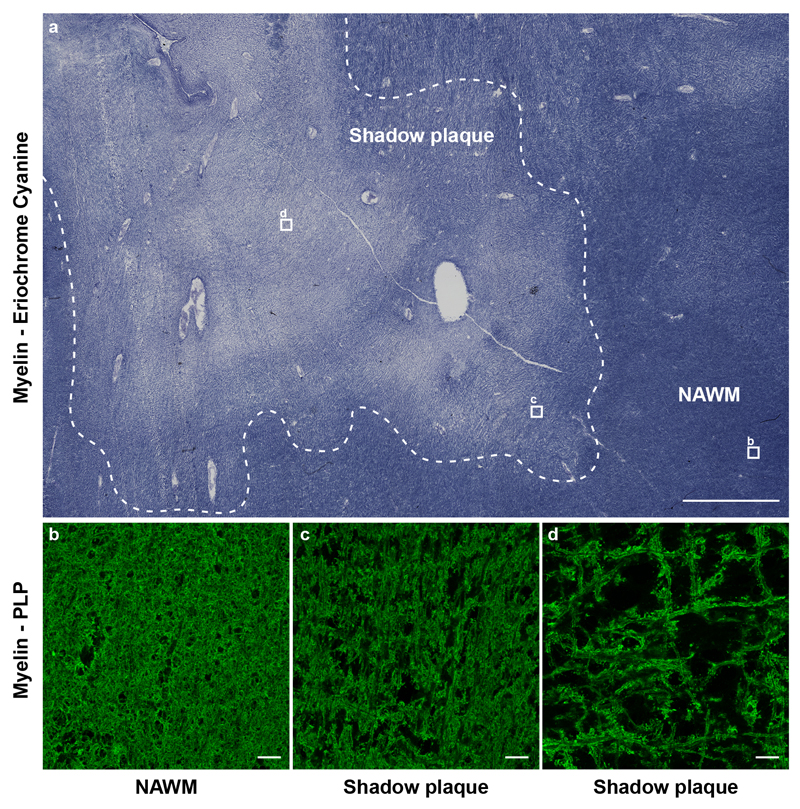
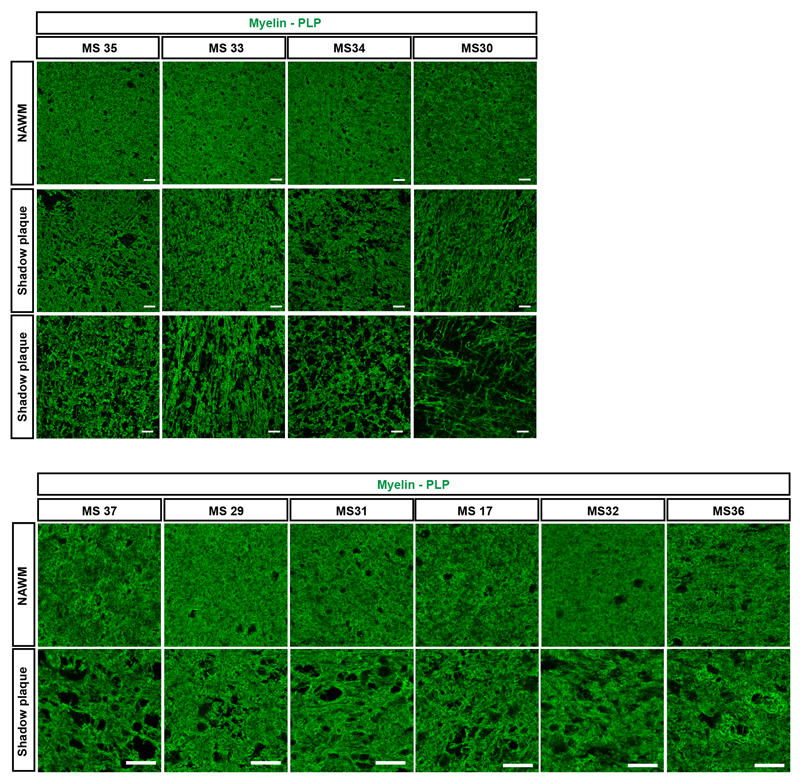
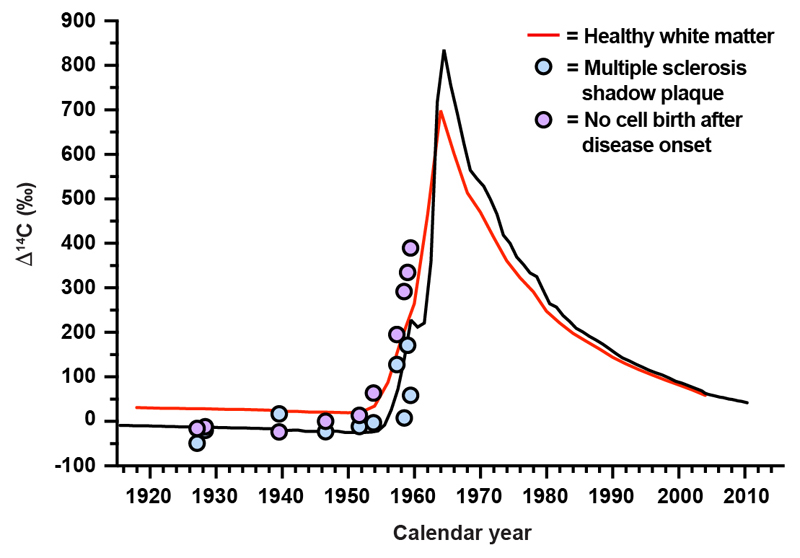
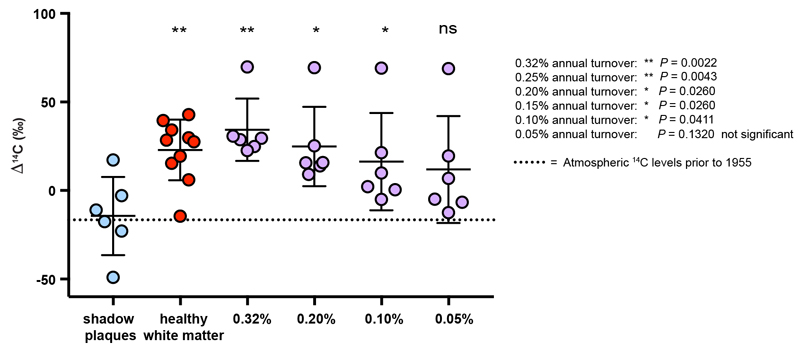
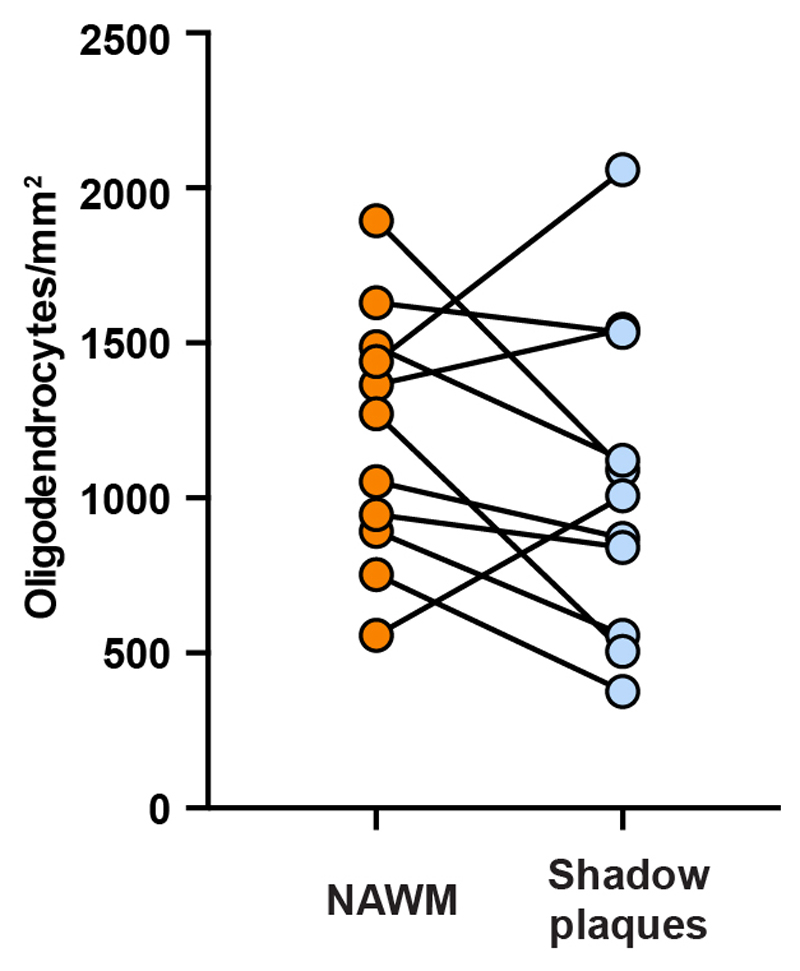
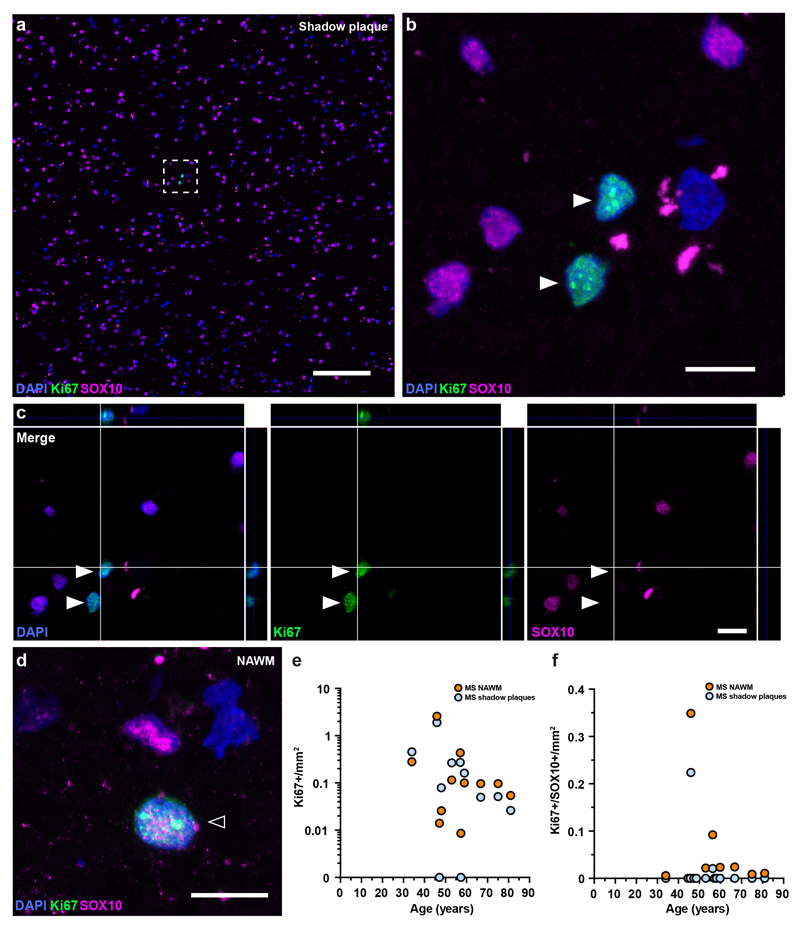
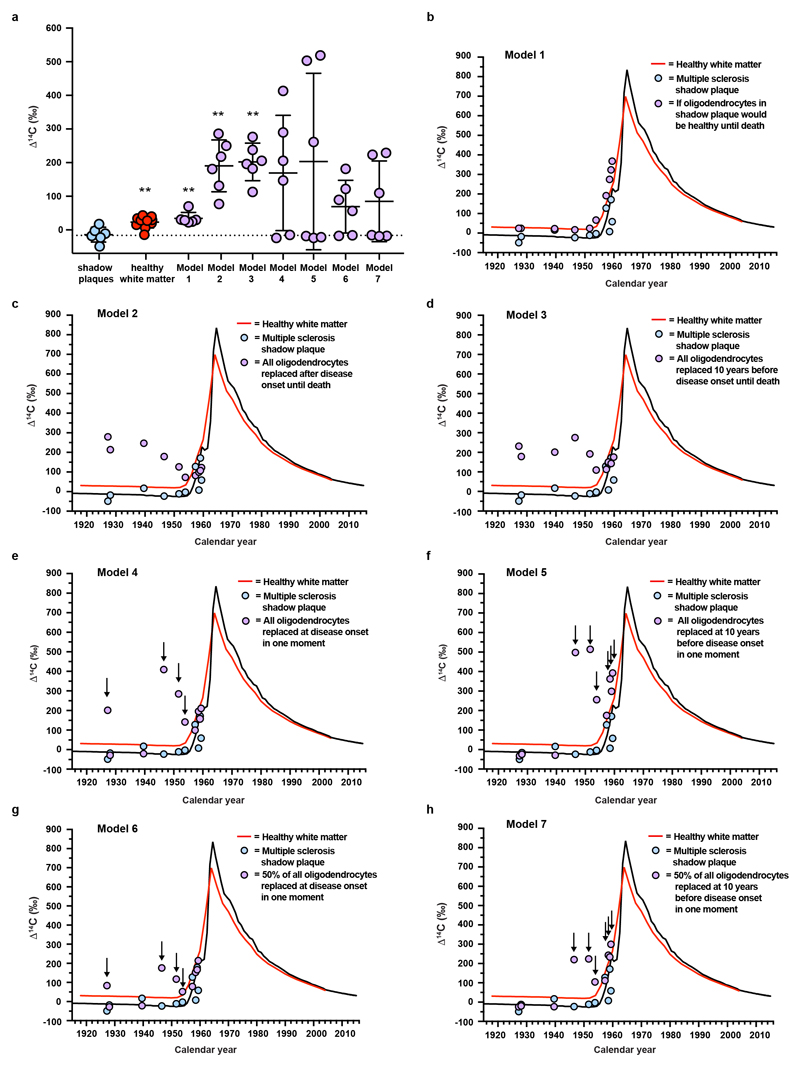
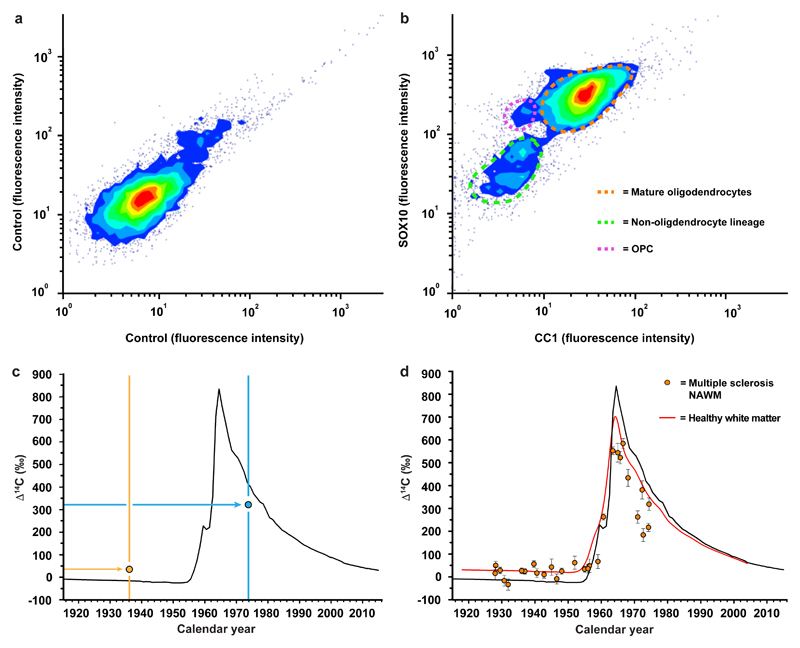
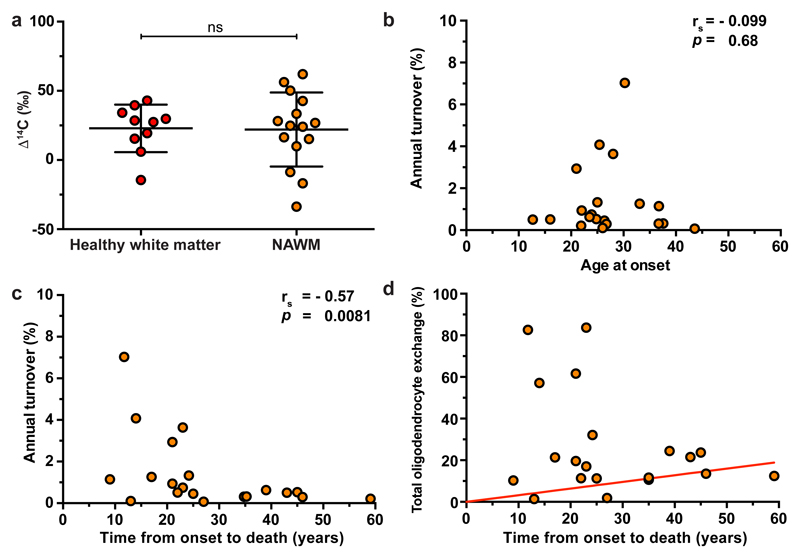
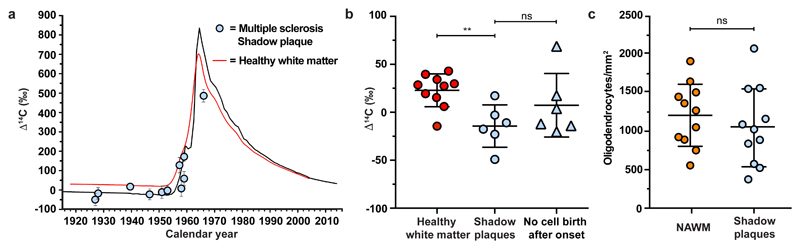
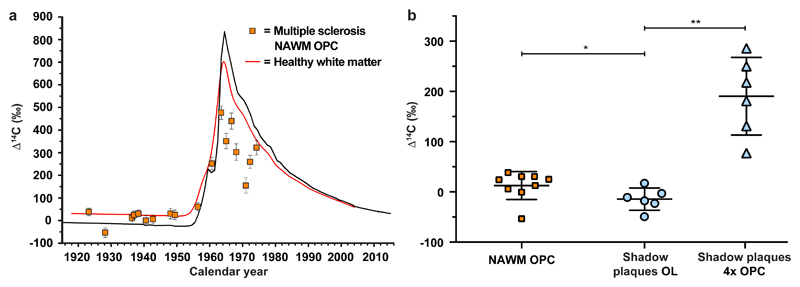
Oligodendrocytes wrap nerve fibres in the central nervous system with layers of specialized cell membrane to form myelin sheaths1. Myelin is destroyed by the immune system in multiple sclerosis, but myelin is thought to regenerate and neurological function can be recovered. In animal models of demyelinating disease, myelin is regenerated by newly generated oligodendrocytes, and remaining mature oligodendrocytes do not seem to contribute to this process2-4. Given the major differences in the dynamics of oligodendrocyte generation and adaptive myelination between rodents and humans5-9, it is not clear how well experimental animal models reflect the situation in multiple sclerosis. Here, by measuring the integration of 14C derived from nuclear testing in genomic DNA10, we assess the dynamics of oligodendrocyte generation in patients with multiple sclerosis. The generation of new oligodendrocytes was increased several-fold in normal-appearing white matter in a subset of individuals with very aggressive multiple sclerosis, but not in most subjects with the disease, demonstrating an inherent potential to substantially increase oligodendrocyte generation that fails in most patients. Oligodendrocytes in shadow plaques-thinly myelinated lesions that are thought to represent remyelinated areas-were old in patients with multiple sclerosis. The absence of new oligodendrocytes in shadow plaques suggests that remyelination of lesions occurs transiently or not at all, or that myelin is regenerated by pre-existing, and not new, oligodendrocytes in multiple sclerosis. We report unexpected oligodendrocyte generation dynamics in multiple sclerosis, and this should guide the use of current, and the development of new, therapies.


Conflict of interest statement

The authors declare no competing financial interests.

Figures

Extended Data Figure 1
Extended Data Figure 1. Flow cytometry reanalysis of isolated cell nuclei from multiple sclerosis patients
a, b, c, Reanalysis of flow cytometry isolated mature oligodendrocytes, oligodendrocyte progenitor cells and non-oligodendrocyte lineage cells show 94.8 ± 2.1%, 82.2 ± 10.2% and 97.6± 2.1% purity respectively (n = 29, n = 24 and n = 28) and the respective contamination of oligodendrocyte progenitor cells (upper left quadrant), non-oligodendrocyte linage cells (lower left quadrant) and mature oligodendrocyte (upper right quadrant) in the isolated population. Value inside the quadrants represent average percentage from all isolated normal appearing white matter of multiple sclerosis patients (mean ± s.d.). The small fraction of contamination of other than the isolated population acquired during flow cytometry isolation was accounted by correcting the 14C values to accurately reflect the isolated cell population. See also Method section and Supplementary Table 1.
Extended Data Figure 2
Extended Data Figure 2. Visualization of myelin in shadow plaques
a, Overview of a carbon dated multiple sclerosis tissue block reveals a shadow plaque and normal appearing white matter (NAWM) by eriochrome cyanine staining (n = 11). The shadow plaque is outlined by a dashed line. b-d, Higher magnification views of areas indicated by boxes in a show reduced myelin (PLP) in all areas compared to NAWM. The images show patient case MS10. See also Supplementary Table 1. Scale bar in a, 2mm; b-d; 20μm.
Extended Data Figure 3
Extended Data Figure 3. Reduced myelin in carbon dated multiple sclerosis shadow plaques
Reduced myelin staining (PLP) was observed in all shadow plaque areas (boarder and center of shadow plaque) compared to NAWM. NAWM and shadow plaque images from each patient were taken from the same sample tissue block (n = 11). See also Supplementary Table 1. Scale bar 20μm.
Extended Data Figure 4
Extended Data Figure 4. Modeled 14C concentration in DNA of oligodendrocytes generated until disease onset
The modeled 14C concentration, for each patient born before the nuclear bomb tests with dated mature oligodendrocytes from a shadow plaque, if there would have been normal oligodendrocyte generation dynamics until the time of disease onset and no further generation thereafter. The measured data from each patient is shown as a blue circle and the modeled data for each patient in purple (n = 11). The red line depicts genomic DNA 14C concentrations in oligodendrocytes from healthy subjects.
Extended Data Figure 5
Extended Data Figure 5. Modelling of the highest possible turnover during the disease period that could occur undetected with carbon dating.
Different annual turnover rates during the disease period were modelled in order to find the highest possible turnover rate that could occur undetected. It was assumed that there was a healthy turnover before disease onset. If a comparison between the measured 14C and the modelled values is significant, we would be able to detect that turnover rate. The lowest turnover rate with significant difference tested was 0.1% annual turnover (P=0.041, two-tailed Mann-Whitney test, n=6). At 0.05% annual turnover, there was no longer a significant difference (P=0.132, two-tailed Mann-Whitney test, n=6). Data are mean (long line), ± s.d (short lines).
Extended Data Figure 6
Extended Data Figure 6. Oligodendrocyte density in shadow plaques
Pair-wise comparison of the density of SOX10+/NOGO-A+ mature oligodendrocytes in histological sections of shadow plaques and adjacent normal appearing white matter in the same patients (n = 11 biopsies from 11 patients).
Extended Data Figure 7
Extended Data Figure 7. Cell proliferation in multiple sclerosis.
a-d, Proliferating cells (Ki67+, arrow heads, a-c) are sparse and proliferating oligodendrocyte progenitor cells are very rare (Ki67+/SOX10+, hollow arrow head, d) in histological sections of shadow plaques (a-c) and adjacent normal appearing white matter (NAWM) (d) from multiple sclerosis patients (n = 11). The box in a indicates the area shown in higher magnification (b) and orthogonal view (c). Scale bar in a, 100μm; b-d; 10μm. e, f Quantification of Ki67+ cells (e) and Ki67+/SOX10+ cells (f) in shadow plaque and adjacent normal appearing white matter in multiple sclerosis patients (n = 11).
Extended Data Figure 8
Extended Data Figure 8. Modeled 14C concentration in DNA of oligodendrocytes generated from oligodendrocyte progenitor cells in shadow plaques
a, Measured and modelled data. The level of atmospheric 14C prior to 1955 are indicated by the dotted line. Mean (long line) ± s.d (short lines). Statistical analyses represent comparison between shadow plaque data (n=6) and the other groups. b-h Measured and modelled data plotted in relation to time and atmospheric 14C concentration. Model 1: Estimated 14C concentration in mature oligodendrocytes (OLs) in shadow plaques if assumed to have healthy turnover rate until death of the patients, is similar to healthy white matter OLs and is significantly higher compared to measured mature OLs in shadow plaques (**, P=0.002, two-tailed Mann-Whitney test, **, P=0.0047, two-tailed Mann-Whitney test, n = 6 and 6). Model 2 and 3: To reconstitute the observed mature OL density with newly made OLs, it would require oligodendrocyte progenitor cells (OPCs) to divide at least 4 times. If this would occur over the time from onset of the disease (model 2) or even from 10 years before the first clinical symptoms (model 3) until death of the patient, it results in significantly higher modeled 14C concentrations in mature OL in shadow plaques than measured (model 2, **, P=0.002, two-tailed Mann-Whitney test, n = 6, model 3, **, P=0.002, two-tailed Mann-Whitney test, n = 6). Model 4 and 5: Even with more conservative scenarios assuming all replacement happening not throughout the disease course, but early by proliferation of OPCs at disease onset or before, still results in higher 14C concentrations in some patients. Model 6, 7: Modeled data as above, but with 50% of OLs being newly made from OPCs and 50% being old OLs. For some patients, the time of disease onset and 10 years before onset occur before the rise of the 14C atmospheric levels (1955). For these patients, any cell replacement by proliferation of old OPC during this period would results in values similar to atmospherical levels. Arrows points to patients with time periods prior to and disease onsets which overlap with very highly elevated atmospheric 14C levels compared to respective levels at time of birth of the patients, and that the modeled values deviate from the measured rules out these scenarios. The red line depicts genomic DNA 14C concentrations in oligodendrocytes from healthy subjects. Healthy white matter (a) **, P=0.0047, two-tailed Mann-Whitney test, (n=10). **, P<0.01. See also Supplementary Table 1, 11 and 12.
Figure 1
Figure 1. Isolation and birth dating of oligodendrocytes from multiple sclerosis patients
a, b, Flow cytometry contour plots of cell nuclei from multiple sclerosis postmortem normal appearing white matter (n = 32, biopsies and patients) displaying fluorescence intensity without primary antibodies (a) or with CC1 and SOX10 antibodies to identify nuclei from mature oligodendrocytes, oligodendrocyte progenitor cells (OPC) and non-oligodendrocyte lineage cells (b). c, Schematic depiction of interpretation of 14C in genomic DNA. The black curve indicates the excess of 14C in the atmosphere above the natural level (Δ14C = 0) as a function of time. The 14C levels increased 1955-1963 due to over ground nuclear bomb tests, and thereafter declined due to diffusion and uptake by the biosphere. The vertical lines indicate the date of birth of two individuals and two hypothetical data points (circles) are placed corresponding to the year of birth and 14C measured in genomic DNA. In an individual born before the onset of the increase in the atmospheric 14C during the Cold War (yellow vertical line and data point), a 14C concentration above the atmospheric curve at the time of birth indicates cell generation after 1955. In a subject born after the peak in the atmospheric 14C concentration (blue), a 14C concentration lower than the atmospheric 14C concentration at the time of birth indicates cell generation after birth. d, Carbon dating of mature oligodendrocytes from normal appearing white matter (NAWM) from multiple sclerosis patients (mean ± 2 s.d., n = 29). The red line indicates the corresponding values from mature oligodendrocytes from healthy subjects born at different times (from ref. 5).
Figure 2
Figure 2. Increased oligodendrocyte generation in multiple sclerosis patients with aggressive disease
a, There is no significant difference in the 14C concentration in genomic DNA of mature oligodendrocytes from white matter of healthy subjects and normal appearing white matter (NAWM) in multiple sclerosis patients born before the onset of the nuclear bomb tests, indicating that turnover dynamics are unaltered by the disease in these individuals (ns, P = 0.85, two-tailed Mann Whitney test, a method to compare two ensembles of randomly distributed values in order to find out whether they are similar within statistical uncertainties or not) (n = 10 and 15). The horizontal lines indicate the mean value (long line) and the s.d. (short lines) of the distribution of Δ14C values. b, The age at onset of multiple sclerosis does not correlate to the oligodendrocyte generation rate in normal appearing white matter. c, Multiple sclerosis patients with aggressive disease and short disease duration to death have a significantly elevated oligodendrocyte generation rate after the multiple sclerosis onset. Individual turnover rate calculations are sensitive to deviations in measured 14C, especially for subjects born during the rapid increase in atmospheric 14C, and two subjects born 1959 and 1956 were excluded in (b, c) due to unrealistically high turnover rates from the analysis. Seven additional subjects were excluded as the turnover rate could not be estimated due to poor fit (n = 20 in b, c). The full data is given in Supplementary Table 4. d, The total proportion of all oligodendrocytes exchanged is dramatically increased in some patients with aggressive disease and short disease duration to death (n = 20). The red line indicates the proportion of oligodendrocytes that are exchanged over time in healthy adults (0.32% per year5). ns, not significant. rs, spearman’s correlation coefficient. p, probability value.
Figure 3
Figure 3. Reduced oligodendrocyte generation in shadow plaques
a, 14C concentration in genomic DNA of oligodendrocyte nuclei isolated from shadow plaques in multiple sclerosis patients. In patients born before the peak in the atmospheric concentration of 14C, most data points are lower than in oligodendrocyte genomic DNA from healthy subjects (red line), indicating reduced generation (mean ± 2 s.d., n = 11). b, Significantly lower 14C concentration in genomic DNA of oligodendrocytes in shadow plaques from multiple sclerosis patients born prior to the increase in atmospheric 14C compared to oligodendrocytes in healthy subjects (**, P=0.0047, two-tailed Mann-Whitney test). The 14C concentration in genomic DNA of mature oligodendrocytes in shadow plaques is similar to the modelled 14C concentration if there would have been no oligodendrocyte generation after the disease onset (ns, P = 0.31, two-tailed Mann-Whitney test) (n = 10, 6 and 6). c, The density of mature oligodendrocytes (SOX10+/NOGO-A+) is not significantly different between shadow plaques and adjacent normal appearing white matter (NAWM) (ns, P =0.26, paired two-tailed t-test, a hypothesis test of the difference between population means for a pair of random samples. (n = 11)). Mean ± s.d (long line ± short lines) (b, c). ns, not significant, ** P<0.01.
Figure 4
Figure 4. Non-mitotic differentiation cannot account for new oligodendrocytes in shadow plaques
a, 14C concentration in oligodendrocyte progenitor cells (OPCs, SOX10+/CC1-) in normal appearing white matter (NAWM) (mean ± 2 s.d., n = 18) compared to mature oligodendrocytes in healthy subjects (red line). b, The 14C concentration in genomic DNA of OPCs in NAWM (n = 9) is significantly higher than in mature oligodendrocytes (OL) in shadow plaques (n = 6) (mean ± s.d.,*, P = 0.0360, two-tailed Mann-Whitney test), indicating that OPCs do not give rise to mature oligodendrocytes by direct differentiation, even without taking into account that they would need to divide several times to make up for the larger number of oligodendrocytes. In the scenario where there would be a subset of OPCs that had not divided after birth, and therefore had a very low 14C concentration in genomic DNA, modeling demonstrates that the 4 cell divisions required to reconstitute the number of oligodendrocytes would result in significantly higher 14C concentrations than measured (mean ± s.d., 4xOPC, **, P=0.0022, two-tailed Mann-Whitney test). *P < 0.05, **P < 0.01.

Comment in

Similar articles

Cited by

References

    1. Nave KA, Werner HB. Myelination of the nervous system: mechanisms and functions. Annu Rev Cell Dev Biol. 2014;30:503–533. doi: 10.1146/annurev-cellbio-100913-013101. - DOI - PubMed
    1. Crawford AH, et al. Pre-Existing Mature Oligodendrocytes Do Not Contribute to Remyelination following Toxin-Induced Spinal Cord Demyelination. Am J Pathol. 2016 doi: 10.1016/j.ajpath.2015.11.005. - DOI - PMC - PubMed
    1. Tripathi RB, Rivers LE, Young KM, Jamen F, Richardson WD. NG2 glia generate new oligodendrocytes but few astrocytes in a murine experimental autoimmune encephalomyelitis model of demyelinating disease. J Neurosci. 2010;30:16383–16390. doi: 10.1523/JNEUROSCI.3411-10.2010. - DOI - PMC - PubMed
    1. Zawadzka M, et al. CNS-resident glial progenitor/stem cells produce Schwann cells as well as oligodendrocytes during repair of CNS demyelination. Cell Stem Cell. 2010;6:578–590. doi: 10.1016/j.stem.2010.04.002. - DOI - PMC - PubMed
    1. Yeung MS, et al. Dynamics of oligodendrocyte generation and myelination in the human brain. Cell. 2014;159:766–774. doi: 10.1016/j.cell.2014.10.011. - DOI - PubMed

Publication types

MeSH terms