. 2019 Jan;565(7741):654-658.
doi: 10.1038/s41586-019-0882-3. Epub 2019 Jan 23.

Tracking tumour evolution in glioma through liquid biopsies of cerebrospinal fluid

Affiliations

Tracking tumour evolution in glioma through liquid biopsies of cerebrospinal fluid

Alexandra M Miller et al. Nature. 2019 Jan.

Abstract

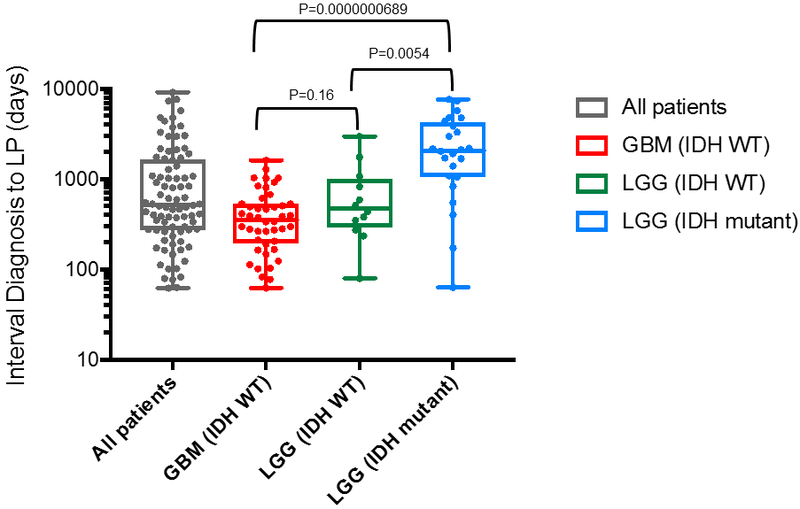
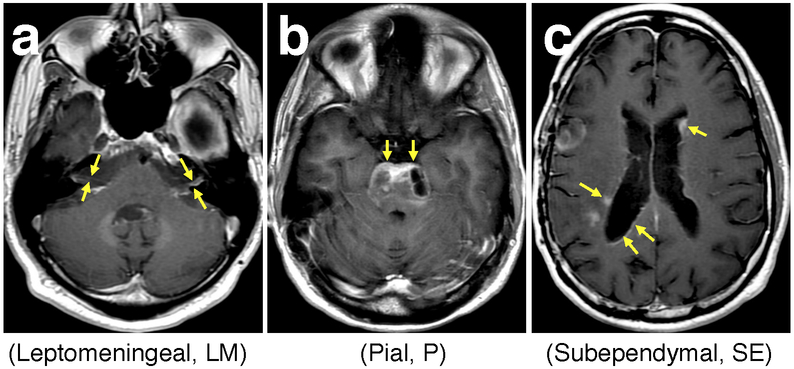
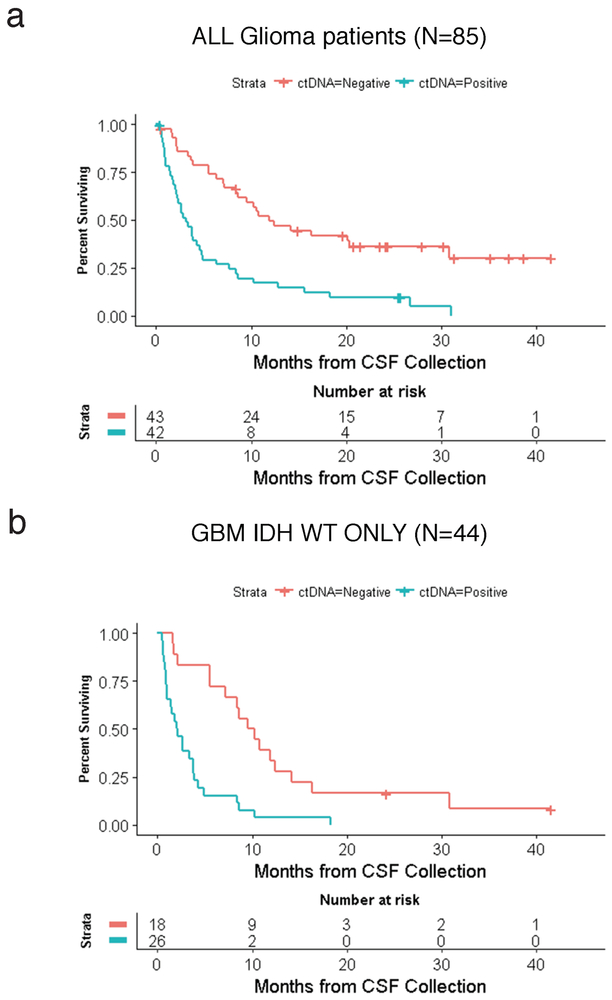
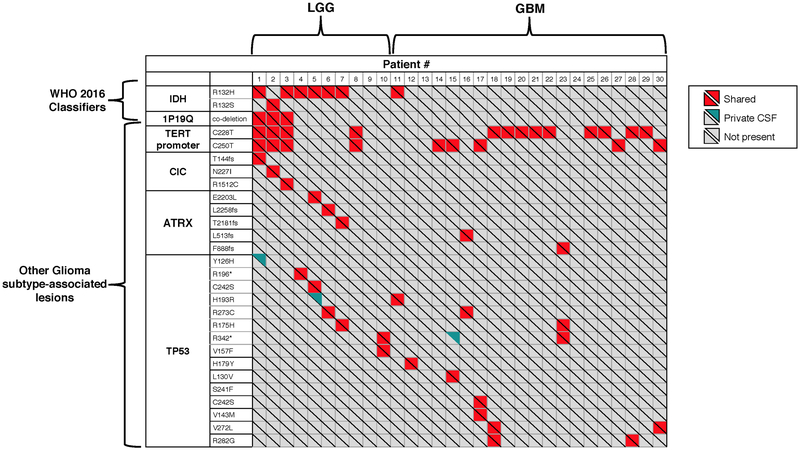
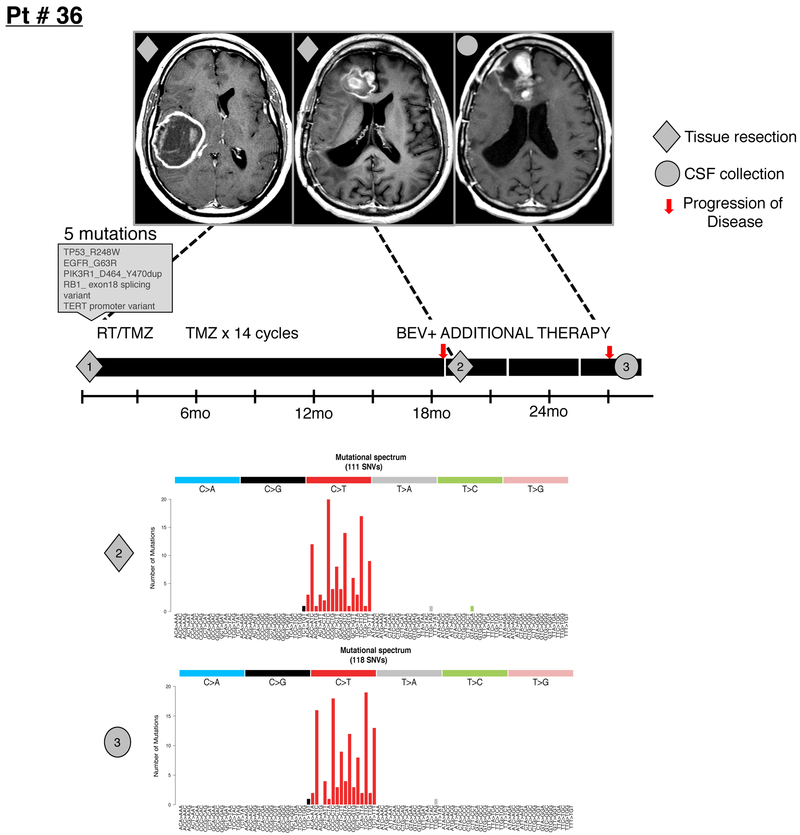
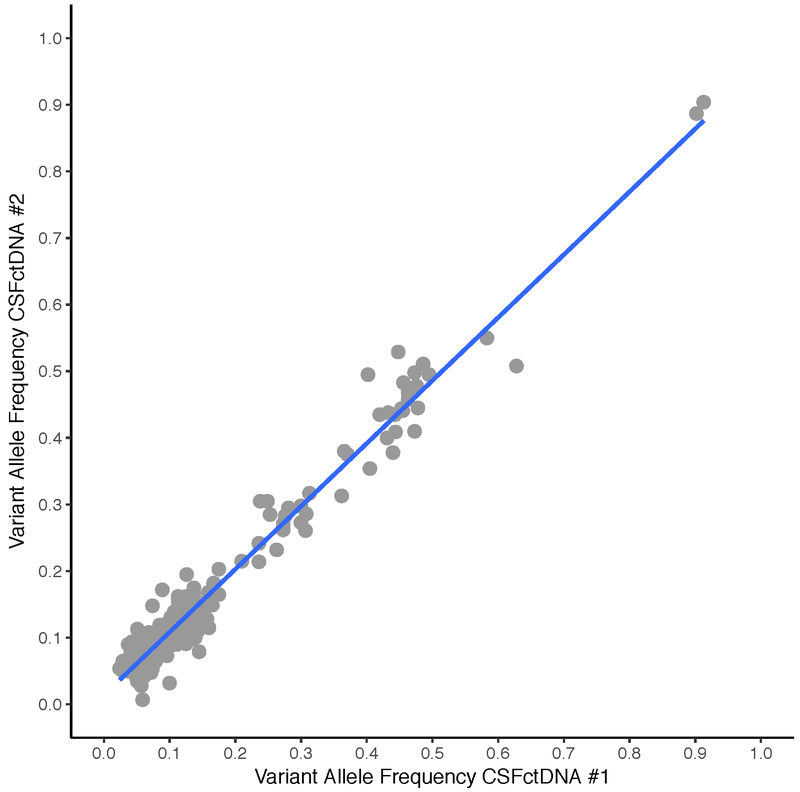
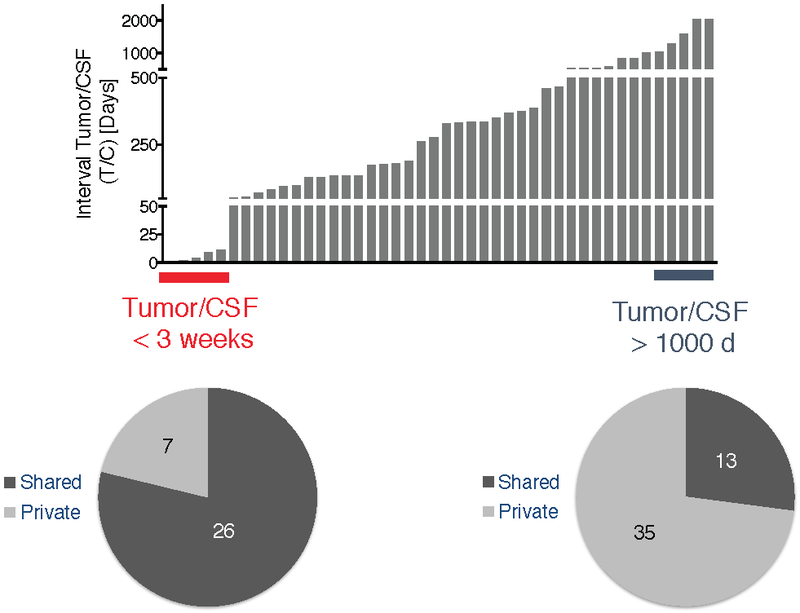
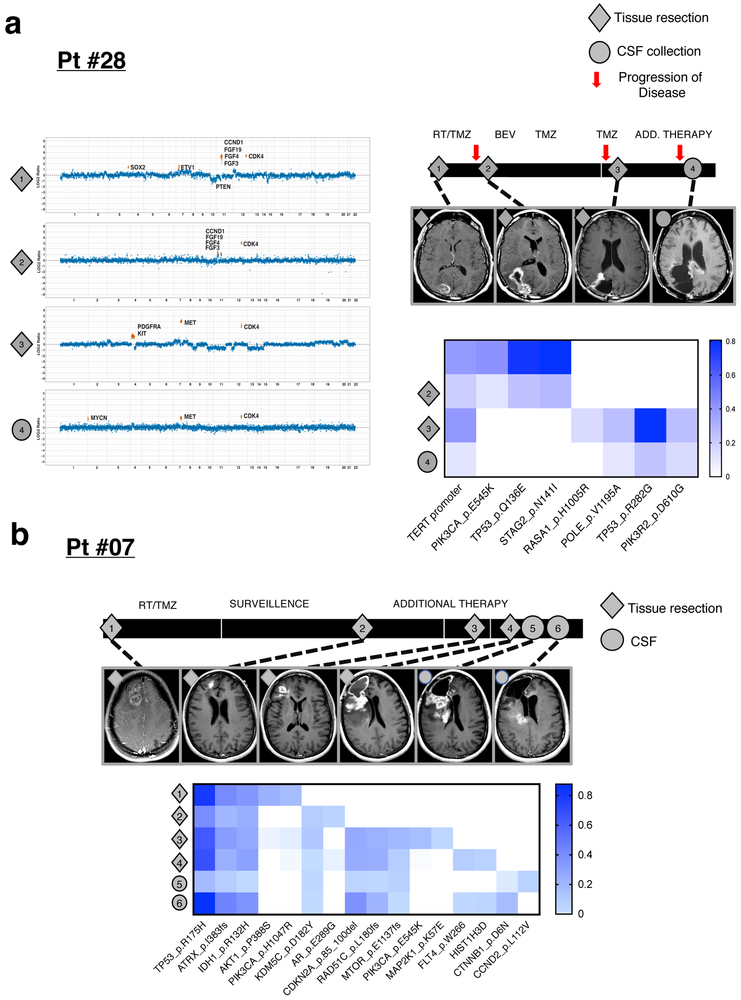
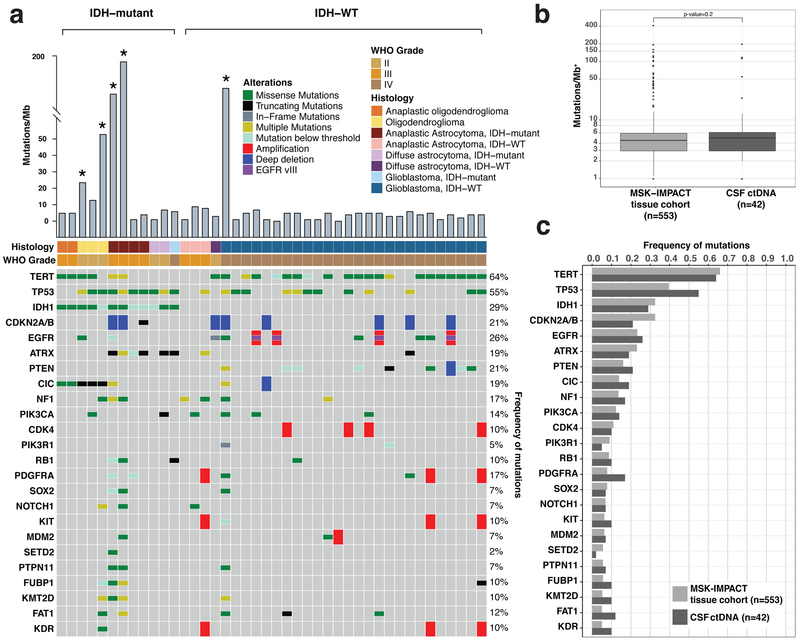
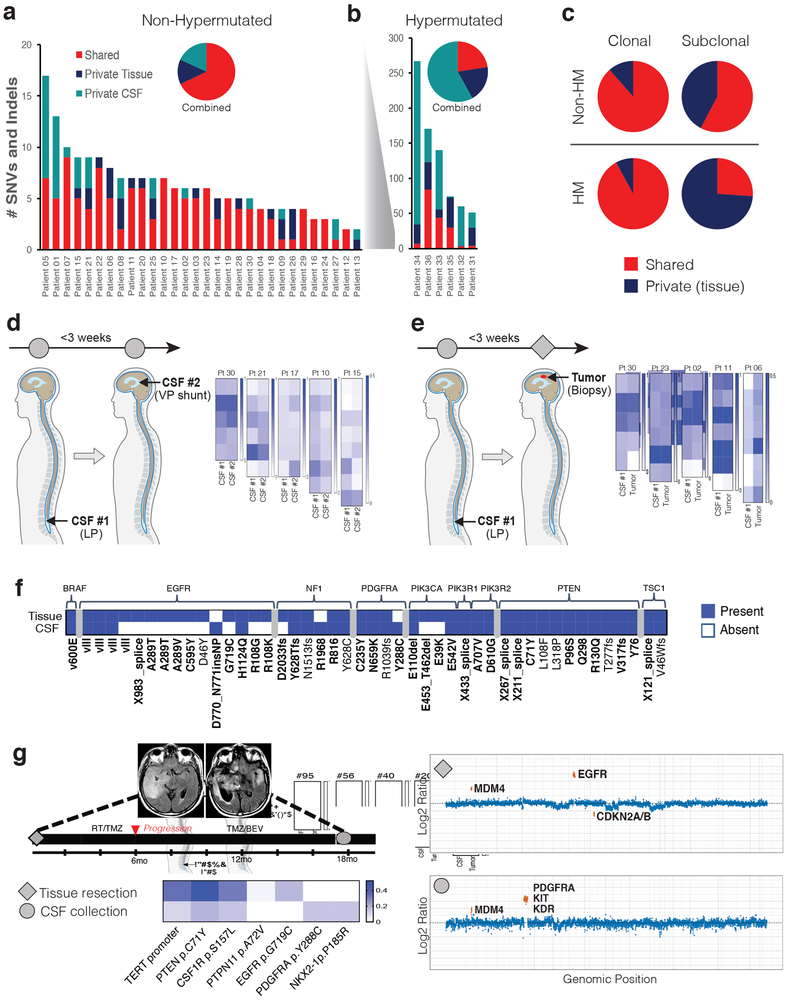
Diffuse gliomas are the most common malignant brain tumours in adults and include glioblastomas and World Health Organization (WHO) grade II and grade III tumours (sometimes referred to as lower-grade gliomas). Genetic tumour profiling is used to classify disease and guide therapy1,2, but involves brain surgery for tissue collection; repeated tumour biopsies may be necessary for accurate genotyping over the course of the disease3-10. While the detection of circulating tumour DNA (ctDNA) in the blood of patients with primary brain tumours remains challenging11,12, sequencing of ctDNA from the cerebrospinal fluid (CSF) may provide an alternative way to genotype gliomas with lower morbidity and cost13,14. We therefore evaluated the representation of the glioma genome in CSF from 85 patients with gliomas who underwent a lumbar puncture because they showed neurological signs or symptoms. Here we show that tumour-derived DNA was detected in CSF from 42 out of 85 patients (49.4%) and was associated with disease burden and adverse outcome. The genomic landscape of glioma in the CSF included a broad spectrum of genetic alterations and closely resembled the genomes of tumour biopsies. Alterations that occur early during tumorigenesis, such as co-deletion of chromosome arms 1p and 19q (1p/19q codeletion) and mutations in the metabolic genes isocitrate dehydrogenase 1 (IDH1) or IDH21,2, were shared in all matched ctDNA-positive CSF-tumour pairs, whereas growth factor receptor signalling pathways showed considerable evolution. The ability to monitor the evolution of the glioma genome through a minimally invasive technique could advance the clinical development and use of genotype-directed therapies for glioma, one of the most aggressive human cancers.


Figures

Extended Data Fig. 1.
Extended Data Fig. 1.. Interval between diagnosis and CSF collection, grouped by glioma subtype.
For the comparison between the GBM (IDH WT) and the LGG (IDH WT) groups the p-value is not significant at 0.16; between the GBM IDH WT and the LGG IDH mutant, the precise p-value is 0.0000000689; between the LGG (IDH WT) and the LGG (IDH mutant) groups the p-value is also significant (P=0.0054). The wilcoxon two sample test was used for two-way comparisons. No adjustments were made for multiple comparisons. The box-plot elements are as follows: All patients (N=85) [Grey box]: Median: 510; Minimum: 62; Maximum: 9122; 25th percentile: 273; 75th percentile: 1606; Maximum: 9122. GBM (IDH WT) (N=44) [Red box]: Median: 354.5; Minimum: 62; Maximum: 1606; 25th percentile: 193; 75th percentile 528. LGG (IDH WT) (N=12) [Green box]: Median: 473; Minimum:79; Maximum: 2982; 25th Percentile: 292; 75th percentile: 1013. LGG (IDH mutant) (N=24) [Blue box]: Median: 2077; Minimum: 63; Maximum: 7669; 25th percentile: 1061; 75th percentile: 4274. Abbreviations: GBM, glioblastoma; LGG, lower grade glioma; IDH, isocitrate dehydrogenase; WT, wildtype. *5 patients were excluded from sub-group analysis due to unknown IDH status.
Extended Data Fig. 2.
Extended Data Fig. 2.. Glioma growth toward CSF spaces.
Shown are representative Brain Magnetic Resonance Imaging (MRI) examples (T1 post-contrast) from patients with distinct patterns of tumor spread. Spread of enhancing disease to the pial, subependymal and subarachnoid spaces was used as an imaging surrogate to estimate tumor spread into the CSF, which is otherwise not visible by MRI. Panel a shows enhancing leptomeningeal spread along the bilateral cranial nerves VII and VIII (arrows). Panel b shows enhancing pial spread to the surface of the pons (arrows). Panel c demonstrates nodular and curvilinear enhancing subependymal spread along both lateral ventricles (arrows).
Extended Data Fig. 3.
Extended Data Fig. 3.. Interval between CSF collection and death for patients with positive (blue) and negative (red) CSF ctDNA.
a, all glioma patients: The median OS for CSF ctDNA-positive subjects was 3.15 months (95% CI: 1.97-4.63). The median OS for CSF ctDNA-negative subjects was 11.91 months (95% CI: 8.40-30.81). The log-rank p-value for comparing the survival experience of all glioma patients stratified by ctDNA status is 0.0000078675. b, GBM IDH WT patients: The median OS for CSF ctDNA-positive subjects was 2.04 months (95% CI: 0.98-3.77). The median OS for CSF ctDNA-negative subjects was 9.89 months (95% CI: 5.54-12.39). The log-rank p-value for comparing the survival experience of GBM IDH WT patients by ctDNA status is 0.000062396. The statistical test was two-sided.
Extended Data Fig. 4.
Extended Data Fig. 4.. Concordance between CSF and tumor in glioma subtype-defining genes.
Concordance between CSF and tumor in glioma subtype-defining genes. Shown are combinations of genetic alterations or “LGG signatures” that are consistently congruent between the CSF and tumor (10/10). This was also the case in Glioblastoma (20/20).
Extended Data Fig. 5.
Extended Data Fig. 5.. DNA hypermutation signature in CSF.
Shown is the disease course for GBM patient # 36 with two tumor resections and one CSF collection. The patient received 14 monthly cycles of temozolomide (TMZ) following the initial tumor resection and postoperative radiation (RT)/temozolomide (TMZ). The initial tumor harbored five mutations, the recurrent tumor 120 mutations and the CSF 132 mutations. MRIs (T1 post contrast) are shown at the time of diagnosis, 1st recurrence and 2nd recurrence. The original tumor was in the R parietal lobe while recurrence was in the R frontal lobe. Diamond=tumor samples profiled; Circle=CSF sample profiled. Bev= Bevacizumab. The bar graph shows the precise n number of SNVs that were called by the IMPACT pipeline in the recurrent tumor (n=120 independent somatic SNVs) and in CSF ctDNA (n=132 independent somatic SNVs)(INDELs were excluded). Bar graphs show the precise number of SNVs for each of the possible tri-nucleotide combinations.
Extended Data Fig. 6.
Extended Data Fig. 6.. Variant allelic frequencies for all SNVs in two independently collected CSF samples from Patient #34 with DNA hypermutation.
Scatter plot of variant allelic frequencies for all SNVs in two independently collected CSF samples from Patient #34 with DNA hypermutation. Both CSF replicates harbored over 200 SNVs. Pearson correlation coefficient (r2=0.966) was calculated based on a linear regression model in R [following Gist (https://gist.github.com/rhshah/3f4965a80886affb96d847dc2ecf69f5)].
Extended Data Fig. 7.
Extended Data Fig. 7.. Divergence of tumor and CSF profiles over time.
The histogram (top) depicts the interval (in days) between tumor and CSF collection. The pie chart below shows that the samples that were collected at a very close interval (<3 weeks; red) had a higher percentage of shared mutations (79 %) than the samples that were collected at a longer interval (>1000 days; blue)(29 %).
Extended Data Fig. 8.
Extended Data Fig. 8.. Evolution of the glioma genome.
a, disease course of Patient #28 (GBM, IDH WT) who received treatment with concurrent radiation(RT)/temozolomide (TMZ), bevacizumab, and a PD-1 inhibitor. The patient underwent three tumor resections and one CSF collection and all four biospecimens were sequenced. The CDK4 amplification was seen in all four samples. Amplifications of PDGFRA/KIT were observed in tumor #3, whereas the later CSF sample (#4) no longer showed the PDGFRA/KIT amplification. b, disease course of Patient #07 (IDH-mutant anaplastic astrocytoma). The patient underwent four tumor resections and 2 CSF collections. All 6 samples were profiled. MRIs (T2 FLAIR) correspond to the time of each tissue resection/CSF recollection. Below is a heat map showing all mutations across the 6 samples. Diamond=tumor samples profiled; Circle=CSF samples profiled. The heatmap indicates the Variant Allelic Frequency (VAF) of the indicated SNVs. TMZ=temozolomide; RT=radiation; Bev=bevacizumab.
Figure 1.
Figure 1.. Genomic Landscape of Glioma in the CSF.
a, Oncoprint of CSF mutations in 42 CSF ctDNA-positive glioma patients. Shown are the most common genetic alterations (SNVs/ Indels/ CNAs/ SVs). CSF ctDNA from 5/42 patients showed DNA hypermutation (labeled with an asterisk). b, and c, Comparison of somatic mutation rates and alterations in CSF ctDNA with somatic mutation rates and alterations detected in tumor tissue in a cohort of MSK patients (also sequenced by MSK-IMPACT, n=553). Panel b shows the median mutational burden in tumor tissue (left) and CSF (right). + = log10 scale. The box-plot elements are as follows for the MSK-IMPACT tissue cohort (N=553): Median = 4.461; Min = 0; Max = 410.240; 25th Percentile = 2.95; and 75th Percentile=5.903 and the CSF ctDNA cohort (N=42): Median = 4.902; Min = 0; Max = 196.078; 25th Percentile = 2.206; 75th Percentile = 5.882. Panel c shows the frequency of the most common genetic alterations in tumor tissue (light grey bars) and CSF (dark grey bars). After excluding hypermutated samples, the median mutation rate in CSF ctDNA and tumor was 3.92/Mb and 3.94/Mb, respectively.
Figure 2.
Figure 2.. CSF ctDNA documents evolution of the glioma genome.
a, b, Frequency of shared versus private mutations in “matched” tumor tissue/CSF sample pairs. Panel A shows results for patients without DNA hypermutation (n=30). Panel B shows results for patients with DNA hypermutation (N=6). The insets show the aggregate number of mutations for each cohort. Red=shared; Blue=private tissue; Teal=private CSF. c, Fraction of shared versus private mutations within clonal and subclonal tumor mutations. Top row: results from tumor/CSF pairs without DNA hypermutation (Non-HM). Bottom row: tumor/CSF pairs with DNA hypermutation (HM). Shared=red and private=blue. d, CSF ctDNA results in contemporaneously collected CSF replicates. Five patients underwent two CSF collections within three weeks [one lumbar puncture (LP) and one ventricular sample collected during VP stent placement]. Heatmaps display the variant allele frequencies of all the mutations detected in either replicate. e, comparison of tumor and CSF pairs collected within a three-week interval. Tumor samples were collected via biopsy and CSF collections were acquired via LP. Heatmaps display the variant allele frequencies of all the mutations present in either sample. f, divergence of mutations in growth factor receptor pathways. Shown is the presence (blue) vs. absence (white) of selected mutations in matched CSF/tumor pairs (N=30, non-hypermutated). Bold: Recurrent somatic mutations, defined as occurring >1 time across all gliomas in the MSKCC cancer cohort n=553. g, Representative example for convergent evolution. Shown is the disease course of patient #25 with GBM. MRIs (T2 FLAIR) are shown from the initial tumor resection (left) and at the time of CSF collection (right). The CSF sample collected at recurrence showed a new PDGFRA amplification and mutation and loss of the previously detected EGFR amplification and EGFR G719C mutation (copy number plots shown). Diamond=tumor sample profiled; Circle=CSF sample profiled. Heatmap VAF scale shown.

Comment in

Similar articles

Cited by

References

    1. Louis DN et al. The 2016 World Health Organization Classification of Tumors of the Central Nervous System: a summary. Acta Neuropathol 131, 803–820, doi:10.1007/s00401-016-1545-1 (2016). - DOI - PubMed
    1. Cancer Genome Atlas Research, N. Comprehensive genomic characterization defines human glioblastoma genes and core pathways. Nature 455, 1061–1068, doi:10.1038/nature07385 (2008). - DOI - PMC - PubMed
    1. Suzuki H et al. Mutational landscape and clonal architecture in grade II and III gliomas. Nat Genet 47, 458–468, doi:10.1038/ng.3273 (2015). - DOI - PubMed
    1. Johnson BE et al. Mutational analysis reveals the origin and therapy-driven evolution of recurrent glioma. Science 343, 189–193, doi:10.1126/science.1239947 (2014). - DOI - PMC - PubMed
    1. Aihara K et al. Genetic and epigenetic stability of oligodendrogliomas at recurrence. Acta Neuropathol Commun 5, 18, doi:10.1186/s40478-017-0422-z (2017). - DOI - PMC - PubMed

Publication types