. 2019 Feb;566(7742):79-84.
doi: 10.1038/s41586-019-0881-4. Epub 2019 Jan 23.

Structural insights into the activation of metabotropic glutamate receptors

Affiliations

Structural insights into the activation of metabotropic glutamate receptors

Antoine Koehl et al. Nature. 2019 Feb.

Erratum in

Abstract

Metabotropic glutamate receptors are family C G-protein-coupled receptors. They form obligate dimers and possess extracellular ligand-binding Venus flytrap domains, which are linked by cysteine-rich domains to their 7-transmembrane domains. Spectroscopic studies show that signalling is a dynamic process, in which large-scale conformational changes underlie the transmission of signals from the extracellular Venus flytraps to the G protein-coupling domains-the 7-transmembrane domains-in the membrane. Here, using a combination of X-ray crystallography, cryo-electron microscopy and signalling studies, we present a structural framework for the activation mechanism of metabotropic glutamate receptor subtype 5. Our results show that agonist binding at the Venus flytraps leads to a compaction of the intersubunit dimer interface, thereby bringing the cysteine-rich domains into close proximity. Interactions between the cysteine-rich domains and the second extracellular loops of the receptor enable the rigid-body repositioning of the 7-transmembrane domains, which come into contact with each other to initiate signalling.


Conflict of interest statement

The authors declare one competing interest: Brian Kobilka and Tong Sun Kobilka are founders of and consultants for ConfometRx, Inc. Dan Feng and Bingfa Sun are employees of ConfometRx, Inc., and Matthew Chu was an employee of ConfometRx, Inc. Readers are welcome to comment on the online version of the paper.

Figures

Extended Data Figure 1
Extended Data Figure 1. Structural Basis of Nb43 Binding to mGlu5
a) Cartoon view of the apo- mGlu5 Nb43 complex, colored by b-factors. Notably, the CRDs are diametrically opposed and do not form a stable interface with each other, as reflected by elevated b- factors. The Nb43 binding interface is highlighted in panel b) with a 2Fo-Fc map of residues comprising CDR3 at 1σ shown as blue mesh. Residues involved in Nb43 binding are located on Helix L and the L-M loop, and are not conserved (c,d). The 2Fo-Fc map of the mGlu5 ECD bound to L-quisqualate and Nb43 is shown in gray mesh at 1σ around a cartoon representation of the refined model (f). Inset shows quality of density in the L-quisqualate binding pocket.
Extended Data Figure 2
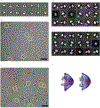
Extended Data Figure 2. Overview of mGlu5 Cryo-EM studies
a) 2D negative stain class averages of apo-mGlu5 in LMNG shows several classes with split detergent micelles. Representative cryo-EM images of apo-mGlu5 in nanodiscs and active mGlu5 bound to L-quisqualate and Nb43 in GDN are shown in b) and c) respectively. Cryo-EM class averages of inactive, and active mGlu5 bound to L-quisqualate and Nb43 are shown in d) and e) respectively. Particle angular distribution of the final cryo-EM reconstructions of apo, and active mGlu5 are shown in the left and right panels of f), respectively.
Extended Data Figure 3
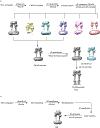
Extended Data Figure 3. Cryo-EM 3D reconstruction workflow
a) Processing workflow of apo mGlu5 in MSP1D1 nanodiscs, and b) apo-mGlu5 bound to Nb43 in GDN.
Extended Data Figure 4
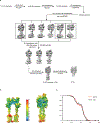
Extended Data Figure 4. Cryo-EM 3D active state processing and map resolution calculations
a) Flow chart of cryo-EM data processing of mGlu5 with Nb43 and quisqualate. b) 3D density maps of mGlu5 and mGlu5 bound to L-quisqualate and Nb43 colored by local resolution. c) ‘Gold standard’ FSC curves from RELION indicate that both mGlu5 and mGlu5+L-quisqualate + Nb43 maps reach nominal resolutions of 4.0Å at FSC=0.143.
Extended Data Figure 5
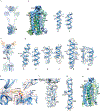
Extended Data Figure 5. Cryo-EM map to model agreement
Representative cryo-EM densities and fitted atomic models for apo (a,b) and active (c-g) mGlu5. The B and C helices of the VFT, and the 7TM domain are highlighted in a) for the apo-mGlu5 structure, and density and model fits are shown in b). Various helices of the VFT, as well as the ligand binding pocket, CRD, and TM6 are highlighted in c, and their cryo-EM density and fitted models are shown in d-h for active mGlu5 bound to L-quisqualate and Nb43.
Extended Data Figure 6
Extended Data Figure 6. Interface comparison between apo and active mGlu5
Comparison of intersubunit interfaces in apo, and active mGlu5 are. Contact regions (purple) show residues within 4 A of the opposite subunit. Notably, apo mGlu5 lacks any interactions beyond the VFT.
Extended Data Figure 7
Extended Data Figure 7. Comparison cryo-EM structures of full length mGlu5 with crystal structures.
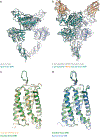
The conformation of the VFT and CRD portions of full length apo mGlu5 obtained by cryo-EM (colored cartoon) is almost identical to the conformation revealed by crystal structure of the full length apo mGlu5 (7TM domain not resolved) (gray cartoon) (a). Similarly, the conformation of the VFT and CRD portions of full length Nb43-bound, active-state mGlu5 obtained by cryo-EM (colored cartoon) is almost identical to the conformation revealed by crystal structure of the ECD bound to L-quisqualate and Nb43 (b). Despite being bound to a NAM (green) and PAM (blue), the 7TM domains of in our full-length structures both align almost identically to a crystal structure of NAM-bound 7TM domain in isolation (c), as well as to each other (d).
Extended Data Figure 8
Extended Data Figure 8. Molecular Dynamics of Nb43
Simulation of the apo-form mGlu5 ECD with, and without Nb43. In the absence of Nb43, the ECD relaxes to an open conformation (right panel) with significant separation between VFT bottom lobes. The presence of Nb43 restricts opening of the ECD to an intermediate degree (middle panel) but does not stabilize the compact R state (left panel).
Extended Data Figure 9
Extended Data Figure 9. Structural transitions in the 7TM domain upon activation.
Activation involves a 20Å translation of the 7TM domains relative to each other (a) followed by a 20˚ rotation around TM4 (b). The 7TM domains of the apo-state are shown as shades of purple, while the active state 7TM domains are shown as shades of blue. c) Model of the I7916.56C mutation on the active state structure shows ideal positioning for disulfide formation. d) Western Blot analysis of disulfide formation of the I7916.56C in both wild-type and C129A background in the presence, and absence, of the NAM MPEP. Bars in d (bottom) represent mean ± SEM from 8 independent experiments. Statistics were performed using Repeated measures one-way ANOVA followed by Tukey’s multiple comparison’s test and indicated P values were adjusted to account for multiple comparisons.
Figure 1
Figure 1. mGlu5 activation through orthosteric and allosteric ligands
a) Schematic of mGlu5 activation, with major domains labeled. ECDs are solidly outlined, while 7TM domains are indicated by a dashed line due to prior uncertainty in their position. b) Nb43 and CDPPB show positive binding cooperativity with the radioligand [3H]-L-quisqualate whereras L-glutamate displaces the radioligand from the orthosteric binding site. c) In absence of co-transfection of the neuronal excitatory amino acid transporter 3 (EAAT3), Nb43 and CDPPB show high intrinsic activity at mGlu5 likely due to ambient cellular-released glutamate. d) Co-expression of EAAT3 completely removes the intrinsic activity of Nb43 and significantly reduces the intrinsic activity of CDPPB. Nb43 (e) and CDPPB (f) increases the potency and thereby show signaling cooperativity with L-quisqualate. For panel b individual datapoints from one representative experiment performed in triplicate is shown of 3 independent experiments with similar results. For panels c-f data represent mean ± SEM from 4 (panel c) or 5 (panel d, e, f) independent experiments.
Figure 2
Figure 2. X-ray structures of mGlu5 ECD in complex with Nb43
a) Overall structure of the mGlu5 ECD+Nb43 complex. Nb43 binds the apex of the VFT through a series of polar interactions as shown in b). c) The overall structure of the mGlu5 ECD with Nb43 and L-quisqualate is similar, but shows a pronounced intersubunit Cysteine Rich Domain (CRD) interface. d) Activation process illuminated by structures of the mGlu5 ECD. Both Nb43 and L-quisqualate lead to an intersubunit reorientation as measured by a reduced B/C helix angle. This brings the VFT bottom lobes together as indicated by a red sphere at the C-terminus of the VFT (Asp 497).
Figure 3
Figure 3. Cryo-EM Maps and Models of Full Length mGlu5
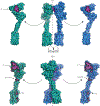
Cryo-EM maps of full length mGlu5 in the a) apo-VFT state, and the b) active state bound to Nb43, and L-quisqualate. Left panels in a) and b) show the same view of mGlu5 in the apo and active conformation, respectively. Right panels in a) and b) are 90˚ rotated relatively to left panels a) and b). Models of apo (c) and active (d) mGlu5 are shown from side (c, d, left panels) and top (c, d, right panels) views. Positions in the VFT (red), CRD (yellow), CRD/7TM interface (purple), and 7TM domain (green) show that the active state is characterized by smaller intersubunit distances. The TM5 position in the apo model (pink) shows that at their closest point, the 7TM domains remain separated.
Figure 4
Figure 4. Structural Changes at the VFT
Comparison of intersubunit VFT interfaces in the apo (a), and active (b) state of mGlu5. The first interface is a hydrophobic patch between residues on B and C helices (black boxes). In the apo form, we observe a tight interface (e,f), while the active state is characterized by a more open interface (g,h). Panels f and h show surface representations of e and g, respectively. The slipping of the B helices relative to each other leads to rearrangement of a polar interface around residue Arg 114 (c,d). Further stabilization may be provided by Nb43 (panel d).
Figure 5
Figure 5. Activation leads to a rearrangement of the 7TM interface
Side views of apo and active mGlu5 CRD and 7TM domains are shown in a) and b) respectively. Top views of the mGlu5 7TM domain in the apo and active state are shown in c) and d) respectively. Both apo and active mGlu5 are shown in the same view after alignment to each other to allow direct comparison. The position of I7916.56 is shown as a sphere for reference. Cross linking of TM6 and subsequent reestablishment of the homodimer after removal of the cross-link in the VFTs by a C129A mutation is less efficient when the receptor is bound to a negative allosteric modulator (MPEP), as shown by yellow bars in e) A TM6 cross-linked mGlu5 is constitutively active (f, top panel) but responds to a 7TM negative modulator (f, bottom panel). Bars in e represent mean ± SEM from 8 independent experiments. Statistics were performed using Repeated measures one-way ANOVA followed by Tukey’s multiple comparison’s test and indicated P values were adjusted to account for multiple comparisons. Data in f represent mean ± SEM from 5 (top panel) and 6 (bottom panel) independent experiments performed in duplicate.
Figure 6
Figure 6. ECL2 is necessary for activation by orthosteric agonists
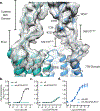
a) Model (teal/blue) and map (gray) showing interactions between the ECL2 of the 7TM domain and the CRD. Residues that make up this interface are shown as spheres at their Cα positions. Deletion of the distal loop residues in ECL2 leads to compromised signaling by the orthosteric agonist both upon low expression of mGlu5 with co-transfection of EAAT3 (b) and whereas the effect of the ago-PAM CDPPB is not compromised (c) likely reflecting disruption of the functional coupling of VFT with the 7TM domain. This mutation has no effect on signaling by the ago-PAM CDPPB at the 7TM domain alone, as shown in (d). Data in panels b-d represent mean ± SEM from 6 independent experiments performed in duplicate or triplicate.

Comment in

Similar articles

Cited by

References

    1. Niswender CM & Conn PJ Metabotropic Glutamate Receptors: Physiology, Pharmacology, and Disease. Annu. Rev. Pharmacol. Toxicol 50, 295–322 (2010). - PMC - PubMed
    1. Pin J-P & Bettler B Organization and functions of mGlu and GABA. Nature 540, 60–68 (2016). - PubMed
    1. Kunishima N et al. Structural basis of glutamate recognition by a dimeric metabotropic glutamate receptor. Nature 407, 971–977 (2000). - PubMed
    1. Kniazeff J et al. Closed state of both binding domains of homodimeric mGlu receptors is required for full activity. Nat. Struct. Mol. Biol 11, 706–713 (2004). - PubMed
    1. Hlavackova V et al. Sequential inter- and intrasubunit rearrangements during activation of dimeric metabotropic glutamate receptor 1. Sci Signal 5, ra59–ra59 (2012). - PubMed

Publication types