

Optimization of Dose Schedules for Chemotherapy of Early Colon Cancer Determined by High-Performance Computer Simulations
- PMID: 30675100
- PMCID: PMC6330731
- DOI: 10.1177/1176935118822804
Optimization of Dose Schedules for Chemotherapy of Early Colon Cancer Determined by High-Performance Computer Simulations
Abstract
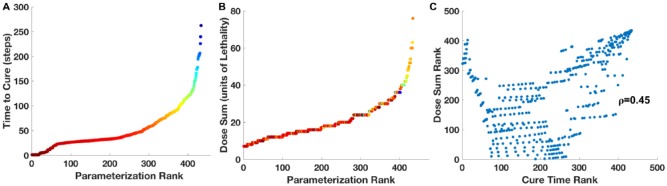
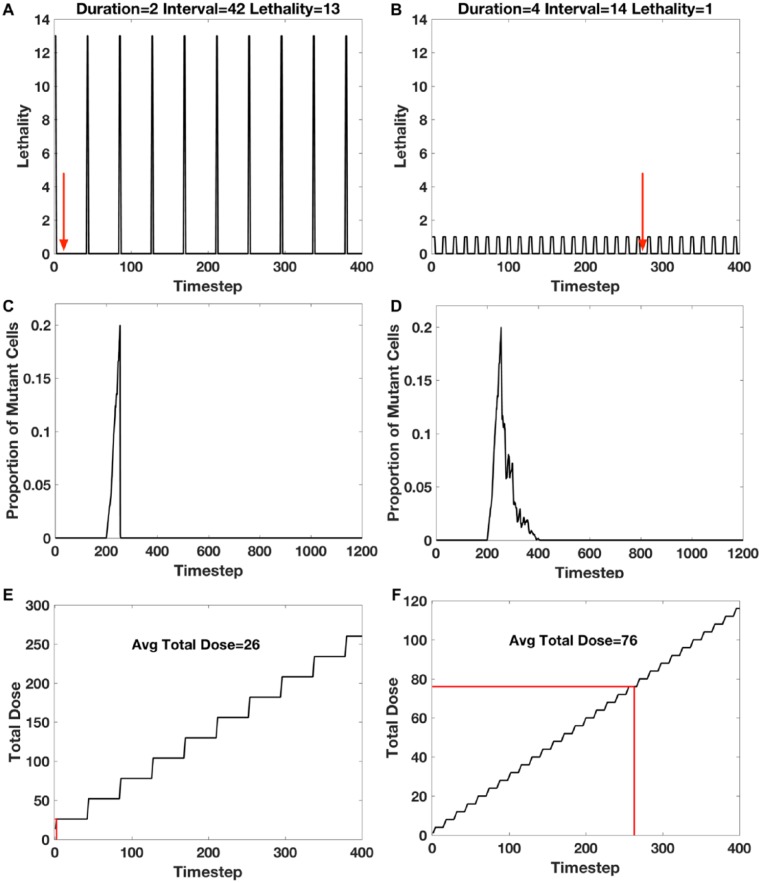
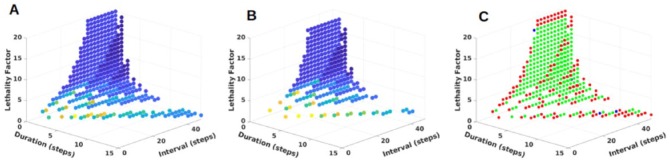
Cancer chemotherapy dose schedules are conventionally applied intermittently, with dose duration of the order of hours, intervals between doses of days or weeks, and cycles repeated for weeks. The large number of possible combinations of values of duration, interval, and lethality has been an impediment to empirically determine the optimal set of treatment conditions. The purpose of this project was to determine the set of parameters for duration, interval, and lethality that would be most effective for treating early colon cancer. An agent-based computer model that simulated cell proliferation kinetics in normal human colon crypts was calibrated with measurements of human biopsy specimens. Mutant cells were simulated as proliferating and forming an adenoma, or dying if treated with cytotoxic chemotherapy. Using a high-performance computer, a total of 28 800 different parameter sets of duration, interval, and lethality were simulated. The effect of each parameter set on the stability of colon crypts, the time to cure a crypt of mutant cells, and the accumulated dose was determined. Of the 28 800 parameter sets, 434 parameter sets were effective in curing the crypts of mutant cells before they could form an adenoma and allowed the crypt normal cell dynamics to recover to pretreatment levels. A group of 14 similar parameter sets produced a minimal time to cure mutant cells. A different group of nine similar parameter sets produced the least accumulated dose. These parameter sets may be considered as candidate dose schedules to guide clinical trials for early colon cancer.
Keywords: agent-based model; chemotherapy; colon cancer; computer simulation; dose schedules; high-performance computer; mutants.
Conflict of interest statement
Declaration of conflicting interests:The author(s) declared no potential conflicts of interest with respect to the research, authorship, and/or publication of this article.
Figures
Similar articles
-
Prevention of Colon Cancer Recurrence From Minimal Residual Disease: Computer Optimized Dose Schedules of Intermittent Apoptotic Adjuvant Therapy.JCO Clin Cancer Inform. 2020 Jun;4:514-520. doi: 10.1200/CCI.20.00016. JCO Clin Cancer Inform. 2020. PMID: 32510974 Free PMC article.
-
Effective chemotherapy of heterogeneous and drug-resistant early colon cancers by intermittent dose schedules: a computer simulation study.Cancer Chemother Pharmacol. 2017 May;79(5):889-898. doi: 10.1007/s00280-017-3272-2. Epub 2017 Mar 25. Cancer Chemother Pharmacol. 2017. PMID: 28343282
-
Combination Chemotherapy of Multidrug-resistant Early-stage Colon Cancer: Determining Optimal Dose Schedules by High-performance Computer Simulation.Cancer Res Commun. 2023 Jan 3;3(1):21-30. doi: 10.1158/2767-9764.crc-22-0271. Epub 2023 Jan 9. Cancer Res Commun. 2023. PMID: 36685168 Free PMC article.
-
Evolving concepts in the systemic drug therapy of breast cancer.Semin Oncol. 1997 Aug;24(4 Suppl 10):S10-3-S10-10. Semin Oncol. 1997. PMID: 9275000 Review.
-
Rituximab: a review of its use in non-Hodgkin's lymphoma and chronic lymphocytic leukaemia.Drugs. 2003;63(8):803-43. doi: 10.2165/00003495-200363080-00005. Drugs. 2003. PMID: 12662126 Review.
Cited by
-
Examining the efficacy of localised gemcitabine therapy for the treatment of pancreatic cancer using a hybrid agent-based model.PLoS Comput Biol. 2023 Jan 17;19(1):e1010104. doi: 10.1371/journal.pcbi.1010104. eCollection 2023 Jan. PLoS Comput Biol. 2023. PMID: 36649330 Free PMC article.
-
Convergent Evolution, Evolving Evolvability, and the Origins of Lethal Cancer.Mol Cancer Res. 2020 Jun;18(6):801-810. doi: 10.1158/1541-7786.MCR-19-1158. Epub 2020 Mar 31. Mol Cancer Res. 2020. PMID: 32234827 Free PMC article. Review.
-
Prevention of Colon Cancer Recurrence From Minimal Residual Disease: Computer Optimized Dose Schedules of Intermittent Apoptotic Adjuvant Therapy.JCO Clin Cancer Inform. 2020 Jun;4:514-520. doi: 10.1200/CCI.20.00016. JCO Clin Cancer Inform. 2020. PMID: 32510974 Free PMC article.
-
Do mechanisms matter? Comparing cancer treatment strategies across mathematical models and outcome objectives.Math Biosci Eng. 2021 Jul 21;18(5):6305-6327. doi: 10.3934/mbe.2021315. Math Biosci Eng. 2021. PMID: 34517535 Free PMC article.
-
Utilizing the Heterogeneity of Clinical Data for Model Refinement and Rule Discovery Through the Application of Genetic Algorithms to Calibrate a High-Dimensional Agent-Based Model of Systemic Inflammation.Front Physiol. 2021 May 19;12:662845. doi: 10.3389/fphys.2021.662845. eCollection 2021. Front Physiol. 2021. PMID: 34093225 Free PMC article.
References
-
- Strum WB. Colorectal adenomas. N Engl J Med. 2016;374:1065–1075. - PubMed
-
- Siegel RL, Miller KD, Fedewa SA, et al. Colorectal cancer statistics. CA Cancer J Clin. 2017;67:177–193. - PubMed
-
- Corley DA, Jensen CD, Marks AR, et al. Adenoma detection rate and risk of colorectal cancer and death. N Engl J Med. 2014;370:2541. - PubMed
Grants and funding
LinkOut - more resources
Full Text Sources
