Oncogenic value of microRNA-15b-5p in hepatocellular carcinoma and a bioinformatics investigation
- PMID: 30675229
- PMCID: PMC6341845
- DOI: 10.3892/ol.2018.9748
Oncogenic value of microRNA-15b-5p in hepatocellular carcinoma and a bioinformatics investigation
Abstract
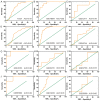
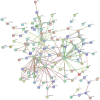
miR-15b-5p has frequently been reported to function as a biomarker in some malignancies; however, the function of miR-15b-5p in hepatocellular carcinoma (HCC) and its molecular mechanism are still not well understood. The present study was designed to confirm the clinical value of miR-15b-5p and further explore its underlying molecular mechanism. A comprehensive investigation of the clinical value of miR-15b-5p in HCC was investigated by data mining The Cancer Genome Atlas (TCGA) and Gene Expression Omnibus (GEO) datasets as well as literature. In addition, intersected target genes of miR-15b-5p were predicted using the miRWalk database and differentially expressed genes of HCC from TCGA. Furthermore, gene ontology (GO) and Kyoto Encyclopedia of Genes and Genomes (KEGG) pathway analyses were carried out. Then, a protein-protein interaction network (PPI) was constructed to reveal the interactions between some hub target genes of miR-15b-5p. The miR-15b-5p expression level in HCC was predominantly overexpressed compared with non-HCC tissues samples (SMD=0.618, 95% CI: 0.207, 1.029; P<0.0001) based on 991 HCC and 456 adjacent non-HCC tissue samples. The pooled summary receiver operator characteristic (SROC) of miR-15b-5p was 0.81 (Q*=0.74), and the pooled sensitivity and specificity of miR-15b-5p in HCC were 72% (95% CI: 69-75%) and 68% (95% CI: 65-72%), respectively. Bioinformatically, 225 overlapping genes were selected as prospective target genes of miR-15b-5p in HCC, and profoundly enriched GO terms and KEGG pathway investigation in silico demonstrated that the target genes were associated with prostate cancer, proximal tubule bicarbonate reclamation, heart trabecula formation, extracellular space, and interleukin-1 receptor activity. Five genes (ACACB, RIPK4, MAP2K1, TLR4 and IGF1) were defined as hub genes from the PPI network. The high expression of miR-15b-5p could play an essential part in hepatocarcinogenesis through diverse regulation approaches.
Keywords: GEO; TCGA; hepatocellular carcinoma; miR-15b-5p; target genes.
Figures


Similar articles
-
Potential clinical value and putative biological function of miR-122-5p in hepatocellular carcinoma: A comprehensive study using microarray and RNA sequencing data.Oncol Lett. 2018 Dec;16(6):6918-6929. doi: 10.3892/ol.2018.9523. Epub 2018 Sep 28. Oncol Lett. 2018. PMID: 30546424 Free PMC article.
-
Clinical Significance of microRNA-196b-5p in Hepatocellular Carcinoma and its Potential Molecular Mechanism.J Cancer. 2019 Aug 29;10(22):5355-5370. doi: 10.7150/jca.29293. eCollection 2019. J Cancer. 2019. PMID: 31632480 Free PMC article.
-
Investigation of the clinical significance and molecular mechanism of miR-21-5p in hepatocellular carcinoma: A systematic review based on 24 studies and bioinformatics investigation.Oncol Lett. 2019 Jan;17(1):230-246. doi: 10.3892/ol.2018.9627. Epub 2018 Oct 26. Oncol Lett. 2019. PMID: 30655760 Free PMC article.
-
Clinical value and potential targets of miR-224-5p in hepatocellular carcinoma validated by a TCGA- and GEO- based study.Int J Clin Exp Pathol. 2017 Sep 1;10(9):9970-9989. eCollection 2017. Int J Clin Exp Pathol. 2017. PMID: 31966887 Free PMC article.
-
A Comprehensive Review on Function of miR-15b-5p in Malignant and Non-Malignant Disorders.Front Oncol. 2022 May 2;12:870996. doi: 10.3389/fonc.2022.870996. eCollection 2022. Front Oncol. 2022. PMID: 35586497 Free PMC article. Review.
Cited by
-
miR-15b, a diagnostic biomarker and therapeutic target, inhibits oesophageal cancer progression by regulating the PI3K/AKT signalling pathway.Exp Ther Med. 2020 Dec;20(6):222. doi: 10.3892/etm.2020.9352. Epub 2020 Oct 15. Exp Ther Med. 2020. PMID: 33363587 Free PMC article.
-
Prognostic value and prospective molecular mechanism of miR-100-5p in hepatocellular carcinoma: A comprehensive study based on 1,258 samples.Oncol Lett. 2019 Dec;18(6):6126-6142. doi: 10.3892/ol.2019.10962. Epub 2019 Oct 4. Oncol Lett. 2019. PMID: 31788087 Free PMC article.
-
Treatment of Human Glioblastoma U251 Cells with Sulforaphane and a Peptide Nucleic Acid (PNA) Targeting miR-15b-5p: Synergistic Effects on Induction of Apoptosis.Molecules. 2022 Feb 15;27(4):1299. doi: 10.3390/molecules27041299. Molecules. 2022. PMID: 35209084 Free PMC article.
-
RHO GTPase-Related Long Noncoding RNAs in Human Cancers.Cancers (Basel). 2021 Oct 27;13(21):5386. doi: 10.3390/cancers13215386. Cancers (Basel). 2021. PMID: 34771549 Free PMC article. Review.
-
miR-15b enhances the proliferation and migration of lung adenocarcinoma by targeting BCL2.Thorac Cancer. 2020 Jun;11(6):1396-1405. doi: 10.1111/1759-7714.13382. Epub 2020 Mar 27. Thorac Cancer. 2020. PMID: 32220063 Free PMC article.
References
LinkOut - more resources
Full Text Sources
Miscellaneous
