. 2019 Jan 18:2:23.
doi: 10.1038/s42003-018-0275-4. eCollection 2019.

MEP50/PRMT5-mediated methylation activates GLI1 in Hedgehog signalling through inhibition of ubiquitination by the ITCH/NUMB complex

Affiliations

MEP50/PRMT5-mediated methylation activates GLI1 in Hedgehog signalling through inhibition of ubiquitination by the ITCH/NUMB complex

Yoshinori Abe et al. Commun Biol. .

Abstract

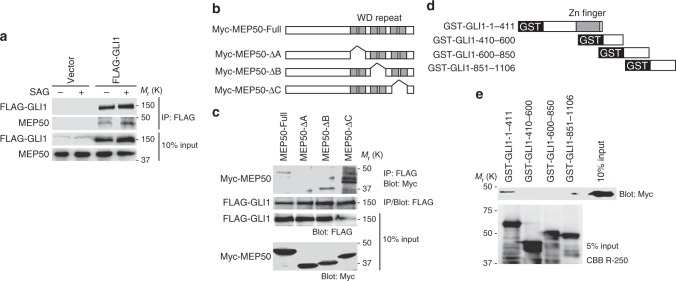
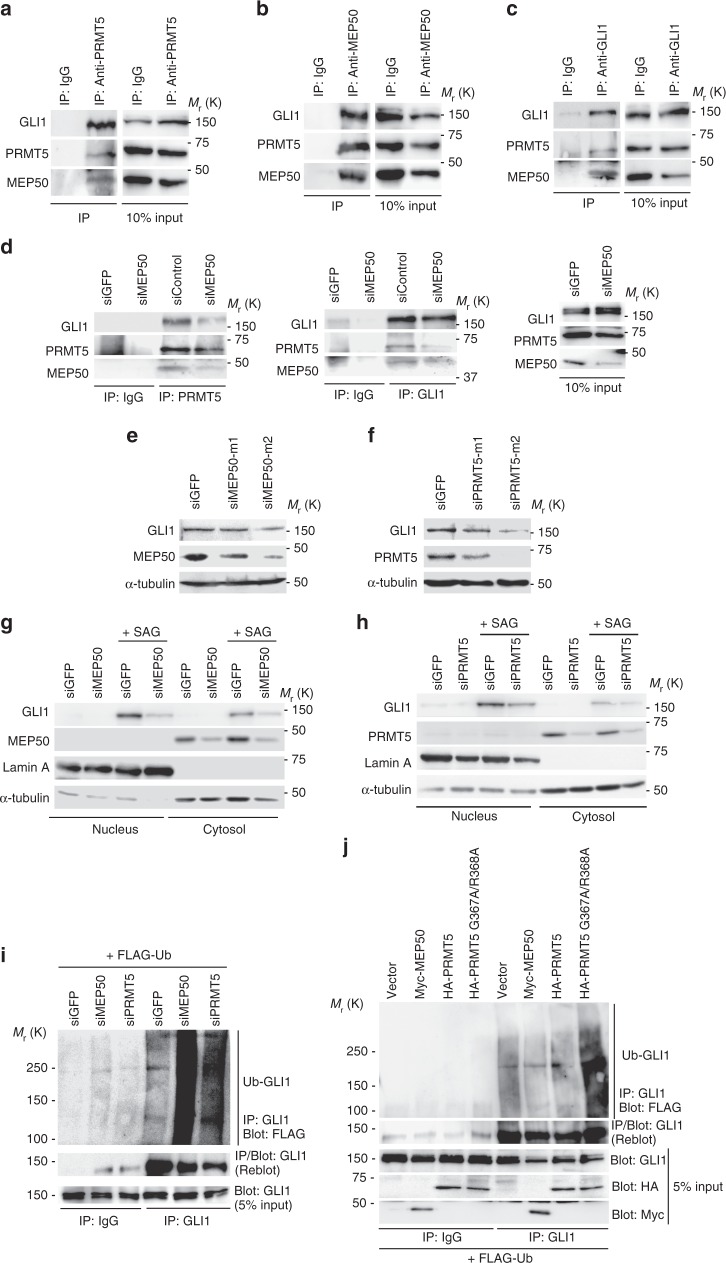
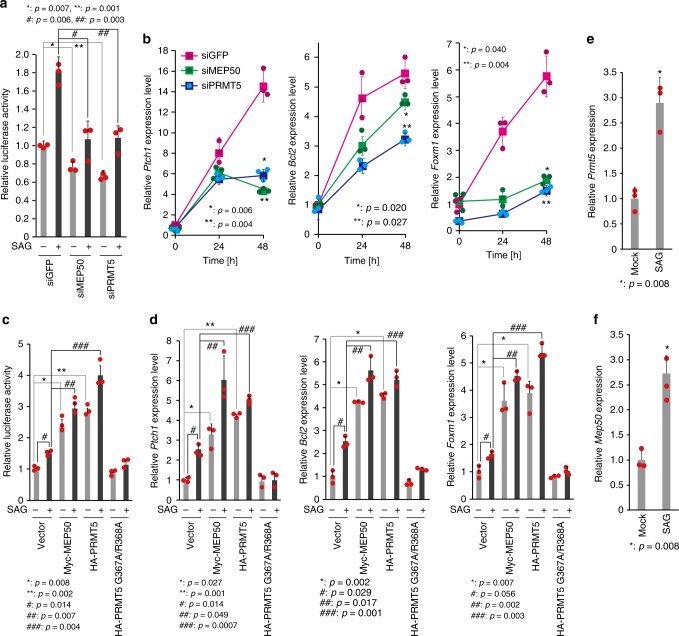
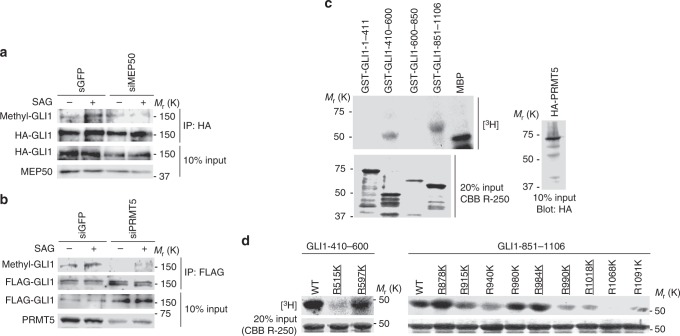
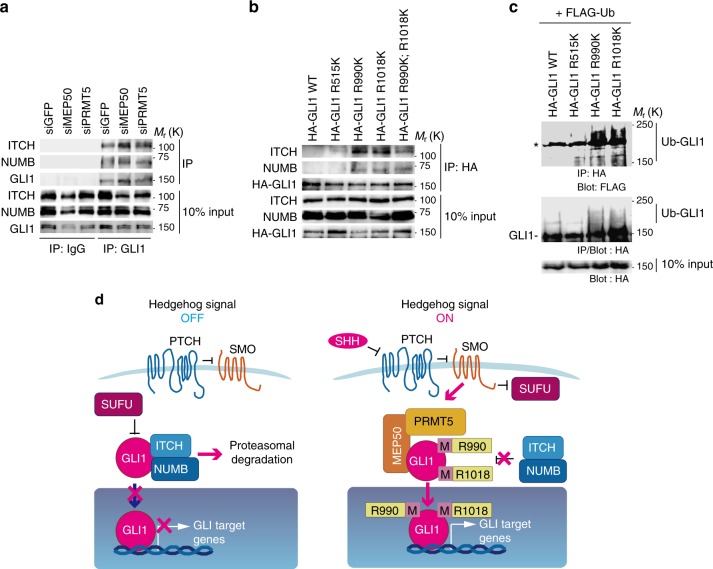
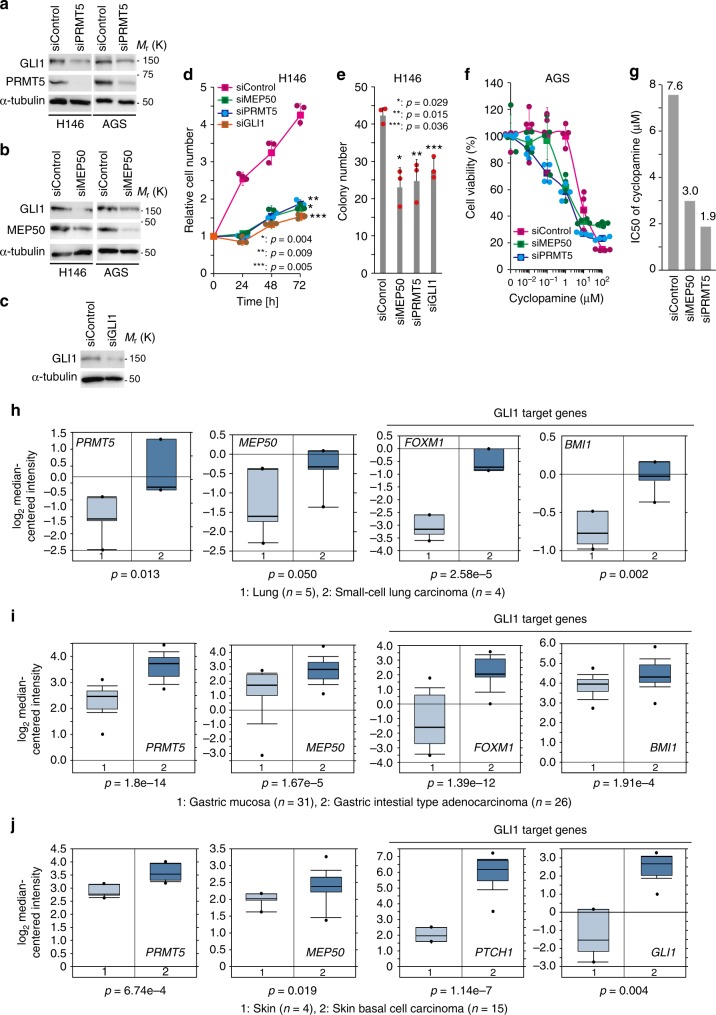
Transcription factor GLI1 is an effecter of Hedgehog (HH) signalling and activated in a broad spectrum of cancers. However, the role of the HH-GLI1 pathway in cancer and the activation mechanism of GLI1 in HH signalling after dissociation from its inhibitor, SUFU, are not fully understood. Here, we found that GLI1 associated with the methylosome protein 50 (MEP50)/protein arginine methyltransferase 5 (PRMT5) complex and was methylated. Association of MEP50/PRMT5 with GLI1 was enhanced and expression of MEP50 and PRMT5 was activated by HH signals, suggesting their role in positive feedback regulation. Methylated GLI1 lost its ability to bind ubiquitin ligase ITCH/NUMB, resulting in nuclear accumulation and activation of GLI1. Moreover, protein expression of GLI1 was enhanced by MEP50/PRMT5 and expression of MEP50, PRMT5, and GLI1 target genes was upregulated in HH-expressing cancers. These results suggest that MEP50/PRMT5 is important for HH signal-induced GLI1 activation, especially in cancers.


Conflict of interest statement

The authors declare no competing interests.

Figures

Fig. 1
Fig. 1
GLI1 interacts with the MEP50/PRMT5 complex. a FLAG-GLI1 interacted with endogenous MEP50 and interaction of FLAG-GLI1 and MEP50 was increased by HH signalling pathway activation. C3H10T1/2 cells were transfected with FLAG-GLI1 or the empty vector for 24 h and then treated with 300 nM SAG for an additional 24 h. Interaction of FLAG-GLI1 and MEP50 was detected by immunoprecipitation with anti-FLAG antibody followed by immunoblot analysis using anti-FLAG and anti-MEP50 antibodies. b Schematic structures of MEP50 deletion mutants. c Mapping of the GLI1-binding region in MEP50 by immunoprecipitation analysis. HEK293T cells were transfected with Myc-MEP50 deletion mutants and FLAG-GLI1 plasmids for 24 h. Interaction of FLAG-GLI1 and Myc-MEP50 deletion mutants was detected by immunoprecipitation with anti-FLAG antibody followed by immunoblot analysis using anti-FLAG and anti-Myc antibodies. d Schematic of GLI1 deletion mutants. e GST pull-down assays to map the MEP50-binding region in GLI1. GST-GLI1 deletion mutants coupled to glutathione sepharose were incubated with immunoprecipitated Myc-MEP50 from HEK293T cells. Immunoblotting was performed with an anti-Myc antibody. In a and e, data represent one of three independent experiments with similar results. In c, data represent one of two independent experiments with similar results. Unprocessed original scans of blots are shown in Supplementary Fig. 6
Fig. 2
Fig. 2
MEP50/PRMT5 complex supports GLI1 activation through GLI1 stabilisation downstream of the HH signalling pathway. a–c Endogenous GLI1/MEP50/PRMT5 complex in C3H10T1/2 cells. Cells were treated with SAG for 36 h, and complex was detected by immunoprecipitation (IP) with anti-PRMT5 (D5P2T) (a), anti-MEP50 (ERP10708 [B]) (b), or anti-GLI1 (V812) (c) antibodies, followed by immunoblot (IB) with antibodies against indicated proteins. d Dissociation of PRMT5 and GLI1 in stable MEP50 knockdown C3H10T1/2 cells by siMEP50-m2. Cells were treated with SAG for 48 h and treated with 50 μM MG132 for 4 h. GLI1/PRMT5 complex was detected by immunoprecipitation with anti-PRMT5 (D5P2T) or anti-GLI1 (V812) antibodies, followed by immunoblot with indicated antibodies. e Immunoblot of endogenous GLI1 in C3H10T1/2 cells expressing MEP50 siRNAs (siMEP50-m1 or siMEP50-m2). f Immunoblot of endogenous GLI1 in C3H10T1/2 cells expressing two independent PRMT5 siRNAs. g Immunoblot of nuclear and cytoplasmic GLI1 and MEP50 in stable MEP50-knockdown (siMEP50-m2) or control siGFP-expressing cells treated with 300 nM SAG. Cells were treated with SAG for 24 h and separated into cytosol and nucleus fractions. h Immunoblot analysis of endogenous nuclear and cytoplasmic GLI1 and PRMT5 in stable PRMT5-knockdown (siPRMT5-m2) C3H10T1/2 cells. Cells were treated with 300 nM SAG for 24 h and then separated as in h. i In vivo ubiquitination of GLI1 in C3H10T1/2 cells with or without expression of siMEP50. FLAG-ubiquitin was transfected into C3H10T1/2 cells. After 48 h of transfection, then cells were treated with 50 µM MG132 for 4 h. Endogenous ubiquitinated GLI1 was immunoprecipitated with an anti-GLI1 (C-1) antibody, followed by immunoblotting with indicated antibodies. j In vivo ubiquitination of GLI1 in C3H10T1/2 cells with exogenous expression of PRMT5 or MEP50. FLAG-ubiquitin and HA-PRMT5, HA-PRMT5 G367A/R368A (inactive form of PRMT5), or Myc-MEP50 were transfected into C3H10T1/2 cells. After 48 h, the cells were treated with 50 µM MG132 for 4 h. Endogenous ubiquitinated GLI1 was detected as described in i. In a, i and j, data represent one of two independent experiments with similar results. Unprocessed original scans of blots are shown in Supplementary Fig. 6
Fig. 3
Fig. 3
MEP50/PRMT5 complex-mediated GLI1 stabilisation enhances Gli transcriptional activity and HH signalling pathway activation induces PRMT5 and MEP50 expression. a Gli transcriptional activity in PRMT5 or MEP50 knockdown cells. siMEP50-m2 and siPRMT5-m2 siRNAs were stably expressed by recombinant retroviruses. A multimerized Gli-binding site luciferase reporter plasmid and phRL-TK control reporter plasmid were transfected into C3H10T1/2 cells. After 24 h of incubation, 300 nM SAG was applied for 24 h, and then luciferase assays were performed. b qRT-PCR analysis of Ptch1, Bcl2, and Foxm1 expression in C3H10T1/2 cells with MEP50 knockdown or PRMT5 knockdown and treated with 300 nM SAG for the indicated times. siMEP50-m2 and siPRMT5-m2 siRNAs were stably expressed by recombinant retroviruses. c Gli transcriptional activity in HA-PRMT5 or Myc-MEP50-expressing cells. HA-PRMT5, HA-PRMT5 G367A/R368A, or Myc-MEP50 and a multimerized Gli-binding site luciferase reporter plasmid and phRL-TK control reporter plasmid were transfected into C3H10T1/2 cells. After 24 h of incubation, 300 nM SAG was applied for 24 h, and then luciferase assays were performed. d qRT-PCR analysis of Ptch1, Bcl2, and Foxm1 expression in HA-PRMT5 or Myc-MEP50-expressing C3H10T1/2 cells. HA-PRMT5, HA-PRMT5 G367A/R368A, or Myc-MEP50 plasmids were transfected into C3H10T1/2 cells. After 24 h of incubation, cells were separated equally, and DMSO (−) or 300 nM SAG (+) were applied for 24 h. Protein levels are shown in Supplementary Fig. 3a. e and f qRT-PCR analysis of PRMT5 (e) and MEP50 (f) mRNA expression in C3H10T1/2 cells after 24 h of treatment with 300 nM SAG. In ac, data represent one of two independent experiments with similar results. In e and f, data represent one of three independent experiments with similar results. The source data is shown in Supplementary Data 1
Fig. 4
Fig. 4
MEP50/PRMT5 complex induces GLI1 methylation. a, b Methylation of GLI1 in MEP50- (a) or PRMT5- (b) knockdown C3H10T1/2 cells. siMEP50-m2 and siPRMT5-m2 siRNAs were stably expressed by recombinant retroviruses. Cells transfected with FLAG-GLI1 were cultured for 24 h, followed by treatment with 300 nM SAG for 24 h. Methylated GLI1 was detected by immunoprecipitation with an anti-FLAG antibody followed by immunoblot with anti-SYM11 antibody. c In vitro methylation assays to determine the region including methylated arginine residues in GLI1 deletion mutants. HA-PRMT5 expression plasmid was transfected into HEK293T cells. At 48 h after transfection, the cells were lysed, and HA-PRMT5 was immunoprecipitated using an anti-HA (3F10) antibody. GST-GLI1 deletion mutants coupled to glutathione sepharose were incubated with immunoprecipitated HA-PRMT5 from HEK293T cells. Upper panel represents the methylated GST-GLI1 deletion mutant. Lower panel represents 20% input of GST-GLI1 deletion mutants detected by CBB R-250 staining. HA-PRMT5 expressed in 10% of total lysate used for immunoprecipitation is shown in the right panel. d In vitro methylation assays to determine methylation sites in GLI1 using amino acid substitutions (arginine to lysine) of candidate methylation sites. In vitro methylation assays were performed as described in (c). Upper panel represents methylated GST-GLI1 mutants. Lower panel represents 20% input of GST-GLI1 mutants detected by CBB R-250 staining. Underlined text denotes highly conserved residues among mammals, as shown in Supplementary Fig. 4. In c, data represent one of three independent experiments with similar results. In a and d, data represent one of twice independent experiments with similar results. Unprocessed original scans of blots are shown in Supplementary Fig. 6
Fig. 5
Fig. 5
MEP50/PRMT5 complex-mediated GLI1 methylation inhibits the interaction of GLI1 with its E3 ligase complex, ITCH/NUMB, resulting in GLI1 stabilisation. a Interaction of GLI1 and endogenous ITCH or NUMB from stably PRMT5-knockdown or MEP50-knockdown C3H10T1/2 cells. siMEP50-m2 and siPRMT5-m2 siRNAs were stably expressed by recombinant retroviruses. MG132 (50 μM) was applied for 4 h before harvesting. b Interaction of GLI1 mutants with endogenous ITCH or NUMB in C3H10T1/2 cells. The cells were transfected as indicated. At 48 h post-transfection, 50 μM MG132 was applied for 4 h, and then the cells were lysed and subjected to immunoprecipitation with an anti-HA antibody, followed by immunoblotting with antibodies against the indicated proteins. c In vivo ubiquitination of HA-GLI1-RK mutants. Cells were transfected and cultured for 24 h, followed by treatment with 50 µM MG132 for 4 h before harvesting. Ubiquitinated GLI1 was detected by immuoprecipitation with an anti-HA (3F10) antibody and immunoblotting with anti-FLAG (upper panel) or anti-HA (lower panel) antibodies. The asterisk denotes non-specific bands. d Schematic diagram of the mechanism of PRMT5/MEP50-mediated GLI1 stabilisation. When the HH signalling pathway inactivates, the ITCH/NUMB E3 ligase complex binds to and ubiquitinates GLI1 for proteasomal degradation. In turn, under HH signalling pathway activation, the MEP50/PRMT5 complex methylates GLI1 to dissociate the ITCH/NUMB complex from GLI1, resulting in GLI1 stabilisation. Unprocessed original scans of blots are shown in Supplementary Fig. 6
Fig. 6
Fig. 6
PRMT5 and MEP50 expression is upregulated in HH pathway-activated cancers, and PRMT5 inhibition is a potential therapeutic strategy for such cancers. a, b Immunoblot analysis of endogenous GLI1 in H146 and AGS cells stably expressing PRMT5 (a) or MEP50 (b) siRNAs. c Immunoblot analysis of endogenous GLI1 in H146 cells stably expressing GLI1 siRNA. In ac, siRNAs were stably expressed via recombinant retroviruses. d Growth curves of PRMT5, MEP50, and GLI1-knockdown H146 SCLC cells. Results are shown in the mean ± s.d. of triplicate experiments. e A quantitative colony formation assay was performed by plating cells at a density of 1 × 104 cells in a six-well plate and incubating them for 14 days. Surviving colonies were counted and represented as the mean ± s.d. of three independent wells. In d and e, siMEP50, siPRMT5, or siGLI1 was stably expressed via recombinant retrovirus in H146 cells. f, g IC50 values of cyclopamine in PRMT5-knockdown or MEP50-knockdown AGS cells. siRNAs were stably expressed via recombinant retroviruses. Cell viability (e) is shown as the mean ± s.d. n = 4. IC50 values of cyclopamine are shown in g. hj Upregulated expression of PRMT5, MEP50, and GLI1 target genes in small cell lung carcinoma (h), gastric adenocarcinoma (i), and skin basal cell carcinoma (j) from the ONCOMINE database (https://www.oncomine.org/). The threshold of data was p ≤ 0.05. Each boxplot shows the log2 maximum, minimum, and median signal intensity of each mRNA from the corresponding expression array. Bold lines on each boxplot define the median value. P-values and sample numbers are indicated in each panel. Unprocessed original scans of blots are shown in Supplementary Fig. 6. Source data of df is shown in Supplementary Data 2

References

    1. Kinzler KW, et al. Identification of an amplified, highly expressed gene in a human glioma. Science. 1987;236:70–73. doi: 10.1126/science.3563490. - DOI - PubMed
    1. Ng JM, Curran T. The Hedgehog’s tale: developing strategies for targeting cancer. Nat. Rev. Cancer. 2011;11:493–501. doi: 10.1038/nrc3079. - DOI - PMC - PubMed
    1. Hui CC, Angers S. Gli proteins in development and disease. Annu. Rev. Cell Dev. Biol. 2011;27:513–537. doi: 10.1146/annurev-cellbio-092910-154048. - DOI - PubMed
    1. Ingham PW, McMahon AP. Hedgehog signaling in animal development: paradigms and principles. Genes Dev. 2001;15:3059–3087. doi: 10.1101/gad.938601. - DOI - PubMed
    1. Beachy PA, Karhadkar SS, Berman DM. Tissue repair and stem cell renewal in carcinogenesis. Nature. 2004;432:324–331. doi: 10.1038/nature03100. - DOI - PubMed

Publication types

MeSH terms