. 2019 Jan 18:2:27.
doi: 10.1038/s42003-018-0259-4. eCollection 2019.

Robustness and Information Transfer within IL-6-induced JAK/STAT Signalling

Affiliations

Robustness and Information Transfer within IL-6-induced JAK/STAT Signalling

Ulrike Billing et al. Commun Biol. .

Abstract

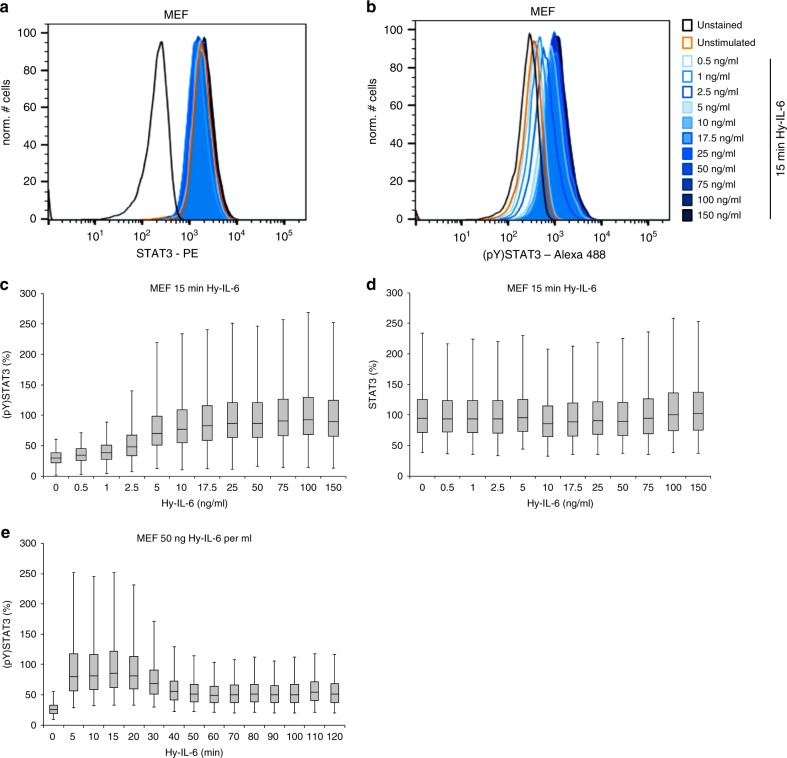
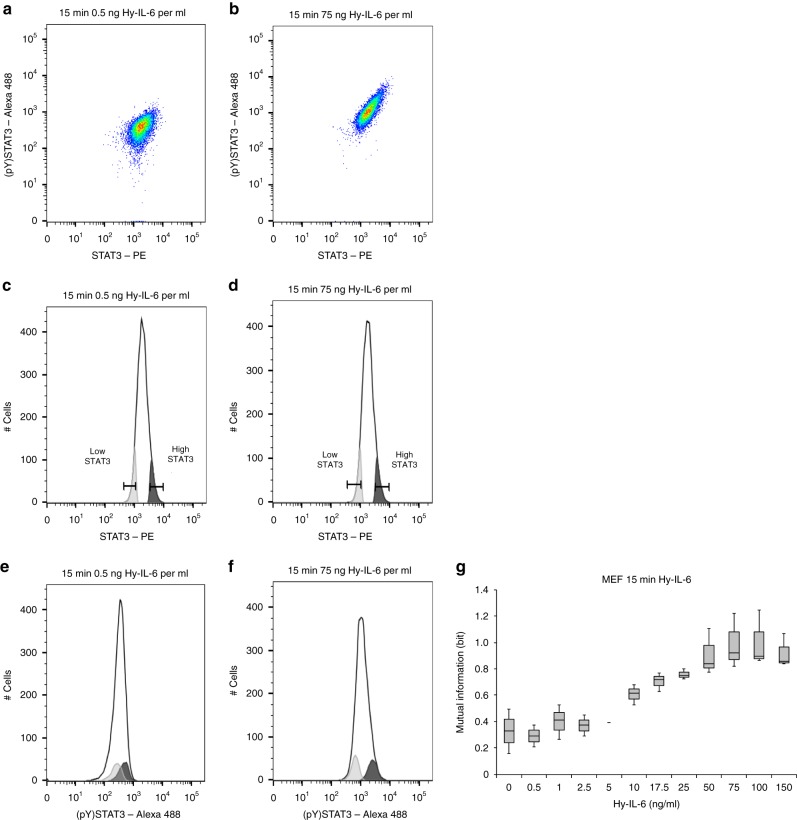
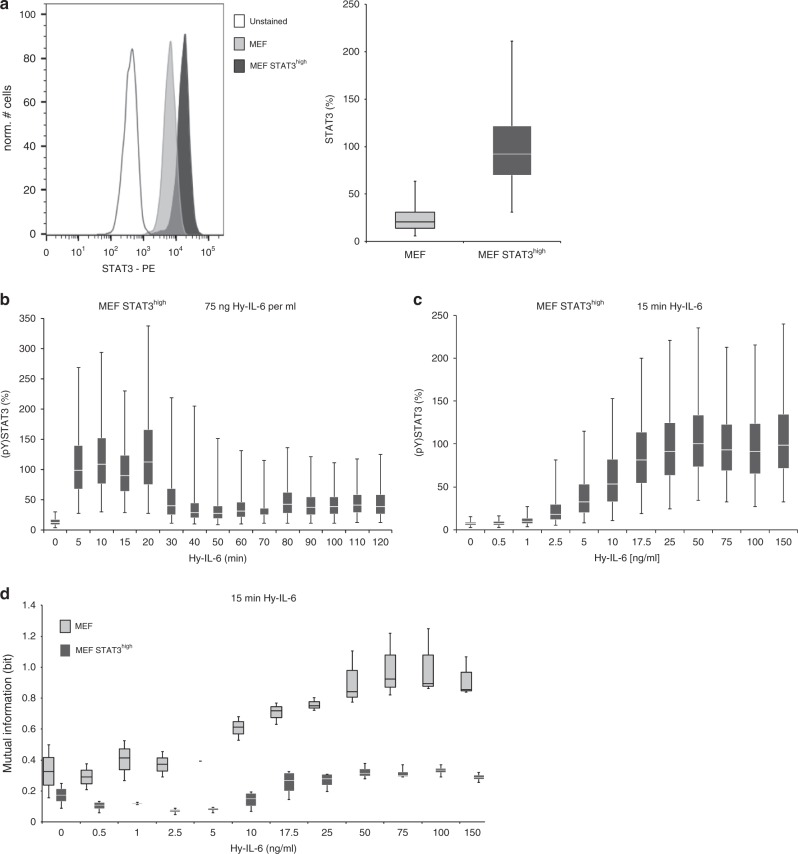
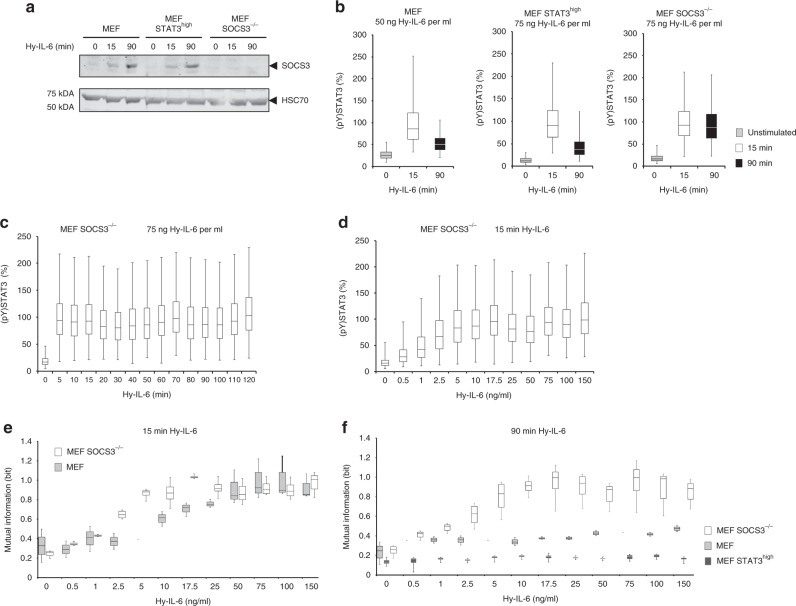
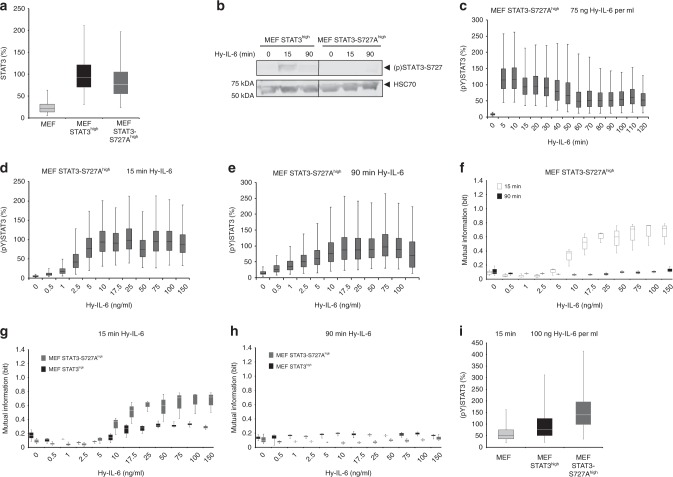
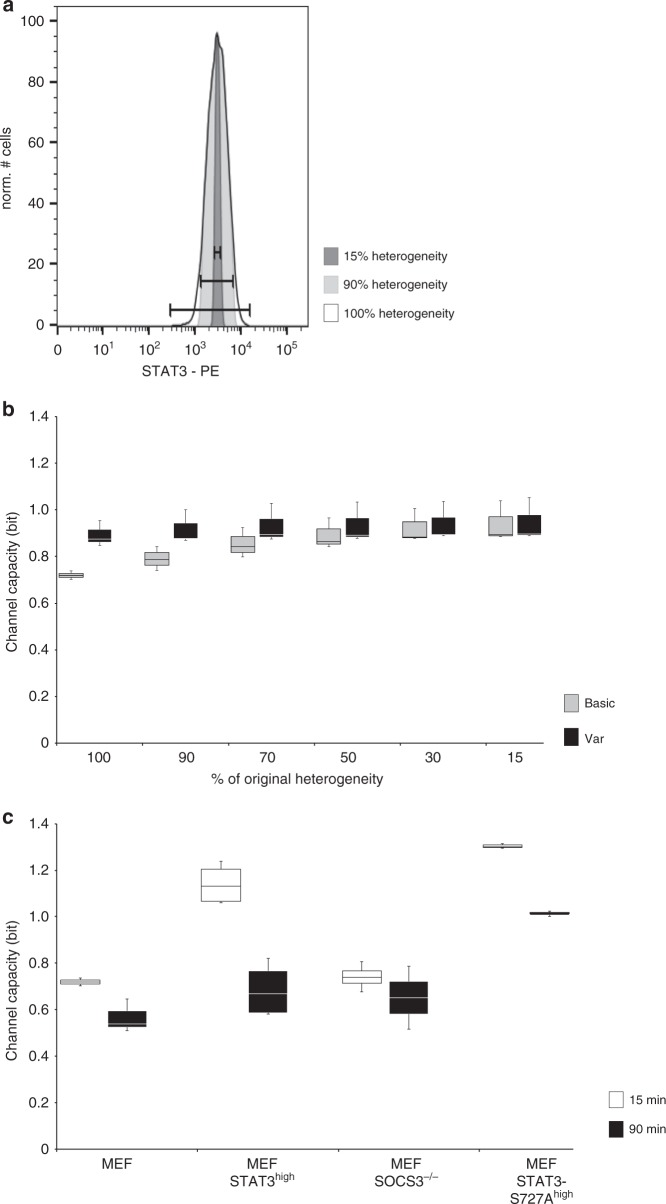
Cellular communication via intracellular signalling pathways is crucial. Expression and activation of signalling proteins is heterogenous between isogenic cells of the same cell-type. However, mechanisms evolved to enable sufficient communication and to ensure cellular functions. We use information theory to clarify mechanisms facilitating IL-6-induced JAK/STAT signalling despite cell-to-cell variability. We show that different mechanisms enabling robustness against variability complement each other. Early STAT3 activation is robust as long as cytokine concentrations are low. Robustness at high cytokine concentrations is ensured by high STAT3 expression or serine phosphorylation. Later the feedback-inhibitor SOCS3 increases robustness. Channel Capacity of JAK/STAT signalling is limited by cell-to-cell variability in STAT3 expression and is affected by the same mechanisms governing robustness. Increasing STAT3 amount increases Channel Capacity and robustness, whereas increasing STAT3 tyrosine phosphorylation reduces robustness but increases Channel Capacity. In summary, we elucidate mechanisms preventing dysregulated signalling by enabling reliable JAK/STAT signalling despite cell-to-cell heterogeneity.


Conflict of interest statement

The authors declare no competing interests.

Figures

Fig. 1
Fig. 1
IL-6 signalling results in a rapid and dose-dependent heterogeneous STAT3 activation. a, b MEF cells were stimulated with increasing amount of Hy-IL-6 for 15 min. STAT3 expression and phosphorylation were evaluated by intracellular multiplex flow cytometry using specific fluorescent antibodies against STAT3 (a) and STAT3 (pY)705 (b). The flow cytometry gating strategy is shown in Supplementary Figure 1. Representative histograms of n = 3 independent experiments are shown. c, d MEF cells were stimulated with increasing amount of Hy-IL-6 for 15 min. STAT3 phosphorylation and expression were evaluated by intracellular multiplex flow cytometry using specific fluorescent antibodies against STAT3 (pY)705 (c) and STAT3 (d). For independent experiments, mean fluorescence of cells per cytokine dose was calculated. Maximal mean fluorescence in each experiment was normalised to 100 %. Data are pooled from n = 3 experiments. e MEF cells were stimulated with 50 ng Hy-IL-6 per ml for the indicated times. STAT3 phosphorylation was evaluated by intracellular flow cytometry using specific fluorescent antibodies against STAT3 (p)Y705. For independent experiments, mean fluorescence of cells per time point was calculated and maximal mean fluorescence in each experiment was normalized to 100 %. The data are from n = 3 experiments
Fig. 2
Fig. 2
Robustness of STAT3 phosphorylation decreases with the strength of stimulation. a, b Pseudocolour plots depicting STAT3-Y705 phosphorylation and STAT3 expression in MEF cells stimulated with 0.5 ng Hy-IL-6 per ml for 15 min (a) or stimulated with 75 ng Hy-IL-6 per ml for 15 min (b). c, d Gating strategy to visualise dependency of STAT3 phosphorylation on STAT3 expression: Two sub populations including 10 % of MEF cells with the lowest (light grey) and the highest (dark grey) STAT3 expression, respectively, for cells stimulated with low amount (c) and high amount of cytokine (d). e, f STAT3 phosphorylation in the low STAT3 and high STAT3 expressing subpopulations was compared to overall STAT3 phosphorylation in the complete population (open histogram) in cells stimulated with low amount (e) and high amount of cytokine (f). Representative results of n = 3 independent experiments are shown. g Based on the data presented in Fig. 1c, d, Mutual Information between STAT3 expression and STAT3-Y705 phosphorylation in MEF cells stimulated for 15 min with Hy-IL-6 was calculated. The data are from n = 3 experiments
Fig. 3
Fig. 3
Robustness of IL-6-induced STAT phosphorylation increases with STAT3 expression. a MEF cells were stably transduced with cDNA for murine STAT3 to gain MEF STAT3high cells. Expression of STAT3 in MEF and MEF STAT3high cells was analysed by intracellular flow cytometry. A representative histogram is shown. For independent experiments mean fluorescence of cells was calculated. Maximal mean fluorescence in each experiment was normalised to 100 %. Box-and-whisker-plot depicts data from n = 3 experiments. b MEF STAT3high cells were stimulated with 75 ng Hy-IL-6 per ml for the indicated times. STAT3 phosphorylation was evaluated by intracellular flow cytometry using specific fluorescent antibodies against STAT3 (pY)705. For independent experiments mean fluorescence of cells per cytokine dose was calculated. Maximal mean fluorescence in each experiment was normalised to 100 %. Data are pooled from n = 3 experiments. c MEF STAT3high cells were stimulated with increasing amount of Hy-IL-6 for 15 min. STAT3 phosphorylation and expression were evaluated by intracellular multiplexed flow cytometry using specific fluorescent antibodies against STAT3 (pY)705 and STAT3 (Supplementary Figure 5). For independent experiments mean fluorescence of cells per cytokine dose was calculated. Maximal mean fluorescence in each experiment was normalised to 100 %. Data are pooled from n = 4 experiments. d Based on the data presented in Fig. 3c and Supplementary Figure 5, Mutual Information between STAT3 expression and IL-6-induced STAT3 phosphorylation in MEF STAT3high cells stimulated for 15 min with Hy-IL-6 was calculated. The data are from n = 4 independent experiments. Overlay with Fig. 2g (MEF) for direct comparison of MEF cells and MEF STAT3high cells
Fig. 4
Fig. 4
The SOCS3-negative feedback loop increases robustness of STAT3 activation against varying STAT3 expression. a MEF, MEF STAT3high, and MEF SOCS3-/- cells were stimulated with 75 ng Hy-IL-6 per ml for the indicated times. SOCS3, and HSC70 protein expression were evaluated by Western blotting. A representative result of n = 6 independent experiments is shown. Uncropped Western blots are depicted in Supplementary Figure 7a, b. b MEF, MEF STAT3high, and MEF SOCS3-/- cells were stimulated with 50 ng Hy-IL-6 per ml or with 75 ng Hy-IL-6 per ml for 15 and 90 min or left untreated. STAT3 phosphorylation was evaluated by intracellular flow cytometry. For independent experiments mean fluorescence of cells per time point was calculated. Maximal mean fluorescence in each experiment was normalised to 100 %. Data from n = 3 experiments. c MEF SOCS3-/- cells were stimulated with 75 ng Hy-IL-6 per ml for the indicated times. STAT3 phosphorylation was evaluated by intracellular flow cytometry. d MEF SOCS3-/- cells were stimulated with increasing amount of Hy-IL-6 for 15 min. STAT3 phosphorylation and expression were evaluated by intracellular multiplex flow cytometry using specific fluorescent antibodies against STAT3 (pY)705 and STAT3 (Supplementary Figure 8b). For independent experiments, mean fluorescence of cells per cytokine dose was calculated. Maximal mean fluorescence in each experiment was normalised to 100%. The data are from n = 4 experiments. e Based on Fig. 4d and Supplementary Figure 8b, Mutual Information between STAT3 expression and STAT3 phosphorylation in MEF SOCS3-/- cells stimulated for 15 min with Hy-IL-6 was calculated. The data are from n = 4 independent experiments. Overlay with Fig. 2g (MEF) for direct comparison of MEF cells and MEF SOCS3-/- cells. f Based on the data presented in Supplementary Figure 9 (for MEF), S10 (for MEF SOCS3-/-), and S11 (for MEF STAT3high), Mutual Information between STAT3 expression and IL-6-induced STAT3 phosphorylation in MEF (light grey), MEF SOCS3-/- (white) and MEF STAT3high (dark grey) cells stimulated for 90 min with Hy-IL-6 was calculated. The data are from n = 3, 4, and 4 independent experiments, respectively
Fig. 5
Fig. 5
STAT3-S727 phosphorylation increases robustness of STAT3 phosphorylation against varying STAT expression. a STAT3 expression in MEF, MEF STAT3high, and MEF STAT3-S727Ahigh cells was evaluated by flow cytometry using fluorescent antibodies against STAT3. For independent experiments mean fluorescence of cells per cell line was calculated. Mean fluorescence of STAT3 expression in MEF STAT3high cells was set to 100%. The data are from n = 3 experiments. b MEF STAT3high and MEF STAT3-S727Ahigh cells were stimulated with 75 ng Hy-IL-6 per ml for the indicated times. STAT3-S727 phosphorylation and HSC70 expression were evaluated by Western blotting. A representative result of n = 6 independent experiments is shown. Uncropped Western Blots are shown in Supplementary Figure 12a, b. c MEF STAT3-S727Ahigh cells were stimulated with 75 ng Hy-IL-6 per ml for the indicated times. STAT3 phosphorylation was evaluated by flow cytometry. d MEF STAT3-S727Ahigh cells were stimulated with increasing amount of Hy-IL-6 for 15 min. STAT3 phosphorylation and expression were evaluated by flow cytometry using fluorescent antibodies against STAT3 (pY)705 and STAT3 (Supplementary Figure 13). The data are pooled from n = 3 experiments. e MEF STAT3-S727Ahigh cells were stimulated with increasing amount of Hy-IL-6 for 90 min and analysed as in d) (Supplementary Figure 14). For independent experiments, mean fluorescence of cells per cytokine dose was calculated. Maximal mean fluorescence in each experiment was normalised to 100 %. Data are from n = 3 experiments. f Based on data presented in Fig. 5d and Supplementary Figure 13, or Fig. 5e and Supplementary Figure 14, Mutual Information between STAT3 expression and IL-6-induced STAT3 phosphorylation in MEF STAT3-S727Ahigh cells stimulated with Hy-IL-6 for 15 min (white) or 90 min (black) was calculated. Data are from n = 3 independent experiments. g Overlay of Fig. 3d and Fig. 3f. h Overlay of Fig. 4f and Fig. 5f. i MEF, MEF STAT3high, and MEF STAT3-S727Ahigh cells were stimulated with 100 ng Hy-IL-6 per ml for 15 min. STAT3 phosphorylation in MEF, MEF STAT3high, and MEF STAT3-S727Ahigh cells was evaluated by flow cytometry. For independent experiments mean fluorescence of cells per cell line was calculated. Mean fluorescence of STAT3 phosphorylation in MEF STAT3high cells was set to 100%. The data are from n = 3 experiments
Fig. 6
Fig. 6
Channel Capacity of IL-6-induced JAK/STAT signalling. a Based on the data presented in Fig. 1 (MEF), the heterogeneity of STAT3 expression in the cell population is reduced by stepwisely excluding cells from the analysis. Starting with exclusion of cells that express the 5% highest and 5% lowest amount of STAT3 (90% residual variability) heterogeneity is reduced until only cells with mean STAT3 expression ± 7.5% were left (15 % residual variability). b Channel capacity of JAK/STAT signalling induced by Hy-IL-6 for 15 min in MEF cells was calculated. Channel Capacity basic and Channel Capacity var were calculated for cells with 100, 90, 70, 50, 30, and 15% residual variability of STAT3 expression. The data are from n = 3 independent experiments. c Based on the data presented in Fig. 1c (MEF), Fig. 3c (MEF STAT3high), Fig. 4d (MEF SOCS3-/-), and Fig. 5d (MEF STAT3-S727Ahigh) Channel Capacity of JAK/STAT signalling induced by Hy-IL-6 for 15 min was calculated. Based on the data presented in Supplementary Figure 9a (MEF), Supplementary Figure 10a (MEF SOCS3-/-), Supplementary Figure 11a (MEF STAT3high), and Fig. 5e (MEF STAT3-S727Ahigh), Channel Capacity of JAK/STAT signalling induced by Hy-IL-6 for 90 min was calculated. Data are from n = 3, 4, 4, and 3 independent experiments, respectively

References

    1. Chalancon G, et al. Interplay between gene expression noise and regulatory network architecture. Trends Genet. 2012;28:221–232. doi: 10.1016/j.tig.2012.01.006. - DOI - PMC - PubMed
    1. Garbers C, Heink S, Korn T, Rose-John S. Interleukin-6: designing specific therapeutics for a complex cytokine. Nat. Rev. Drug. Discov. 2018;17:395–412. doi: 10.1038/nrd.2018.45. - DOI - PubMed
    1. Kamimura D, Ishihara K, Hirano T. IL-6 signal transduction and its physiological roles: the signal orchestration model. Rev. Physiol. Biochem. Pharmacol. 2003;149:1–38. - PubMed
    1. Heinrich PC, et al. Principles of interleukin (IL)-6-type cytokine signalling and its regulation. Biochem. J. 2003;374:1–20. doi: 10.1042/bj20030407. - DOI - PMC - PubMed
    1. Scheller J, Chalaris A, Schmidt-Arras D, Rose-John S. The pro- and anti-inflammatory properties of the cytokine interleukin-6. Biochim. Biophys. Acta. 2011;1813:878–888. doi: 10.1016/j.bbamcr.2011.01.034. - DOI - PubMed

Publication types

MeSH terms