. 2019 Jan;7(2):e13983.
doi: 10.14814/phy2.13983.

Tuberous sclerosis complex exhibits a new renal cystogenic mechanism

Affiliations

Tuberous sclerosis complex exhibits a new renal cystogenic mechanism

John J Bissler et al. Physiol Rep. 2019 Jan.

Abstract

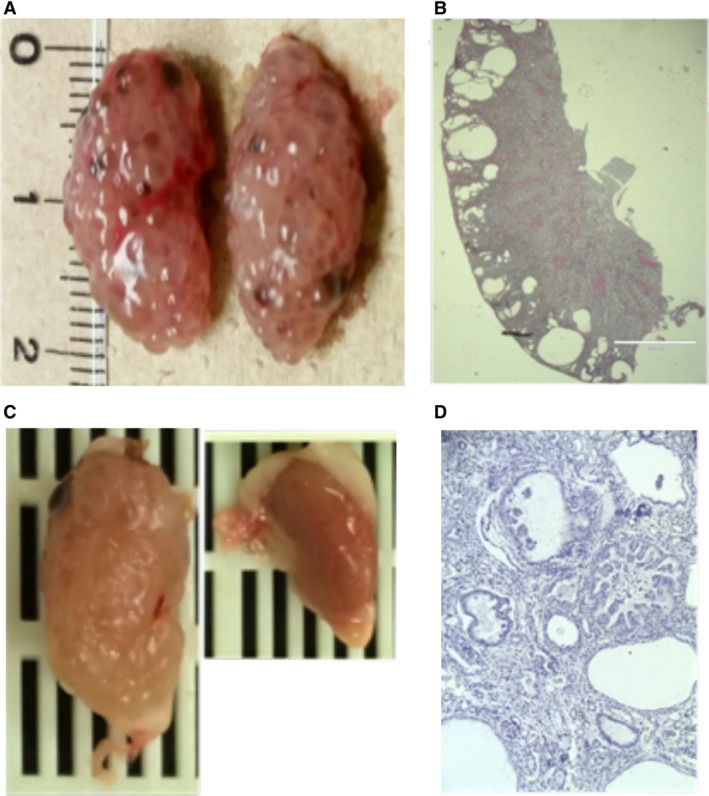
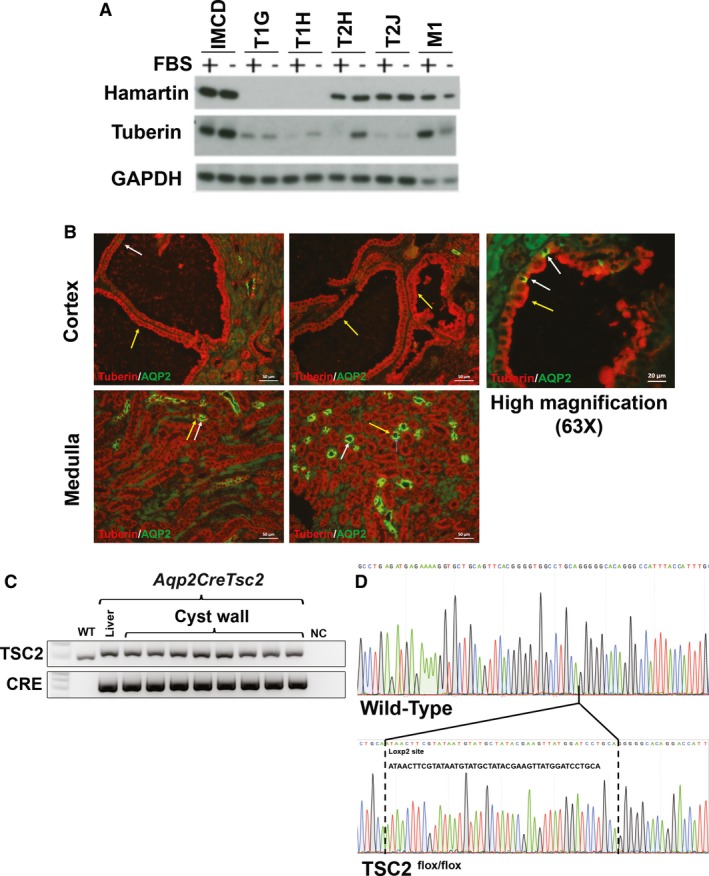
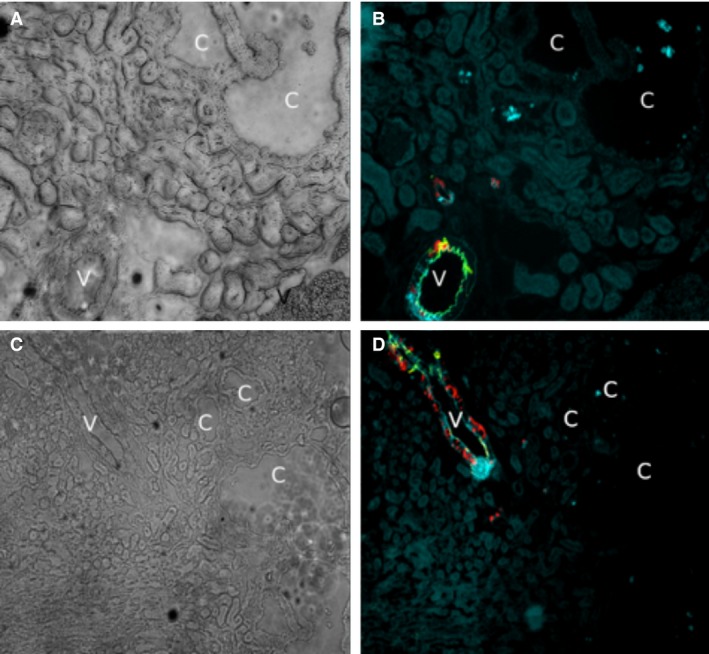
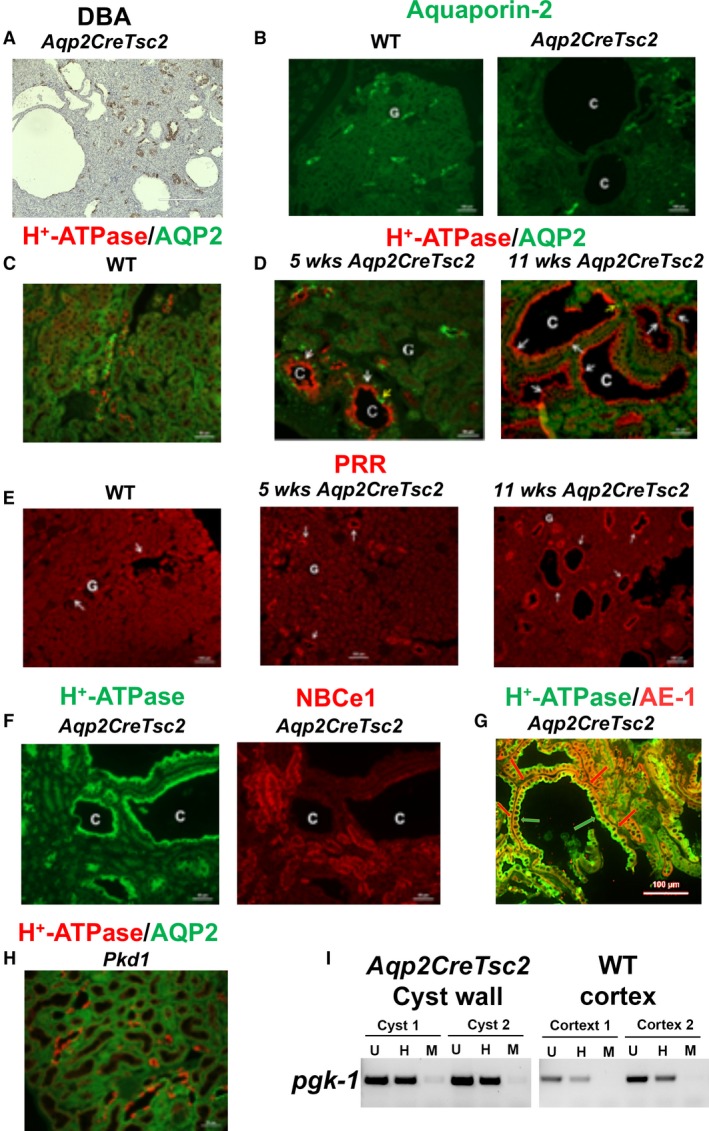
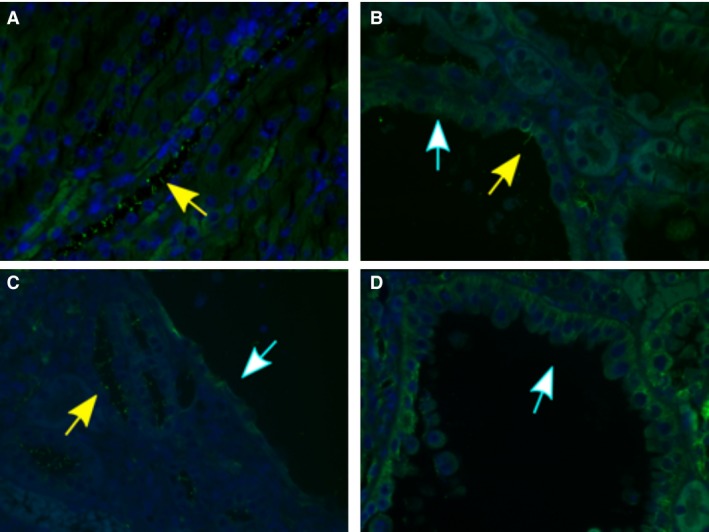
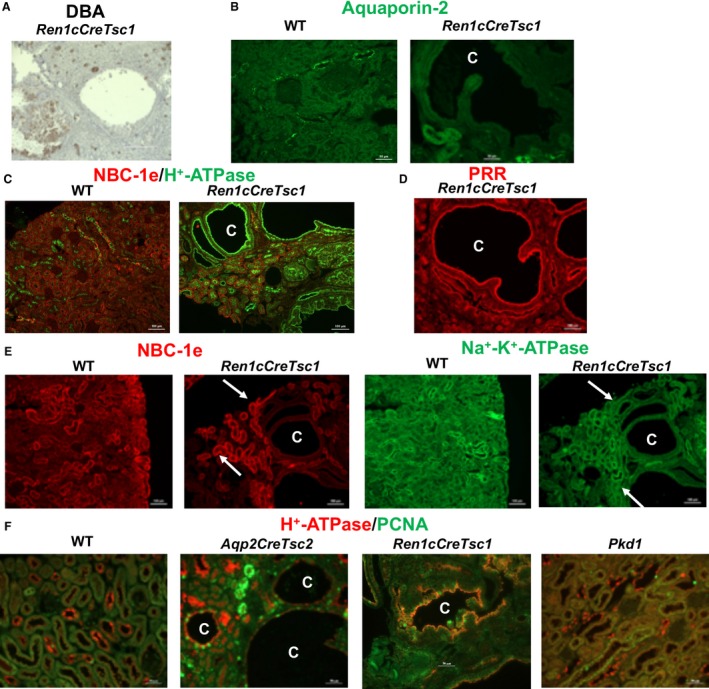
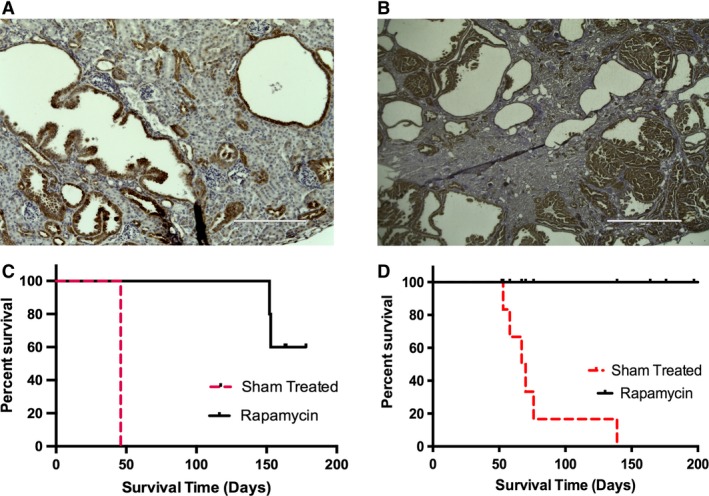
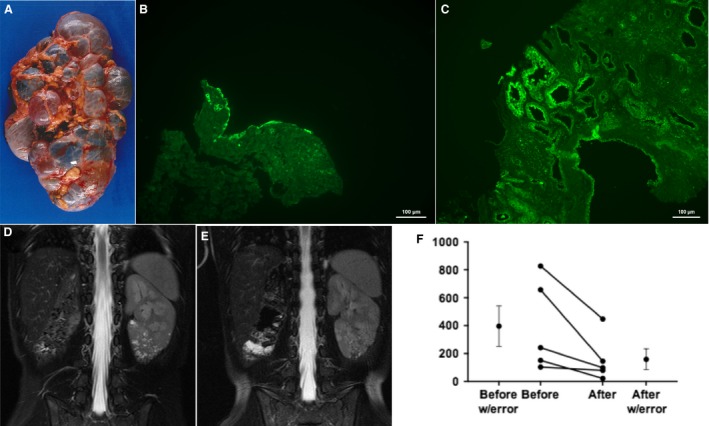
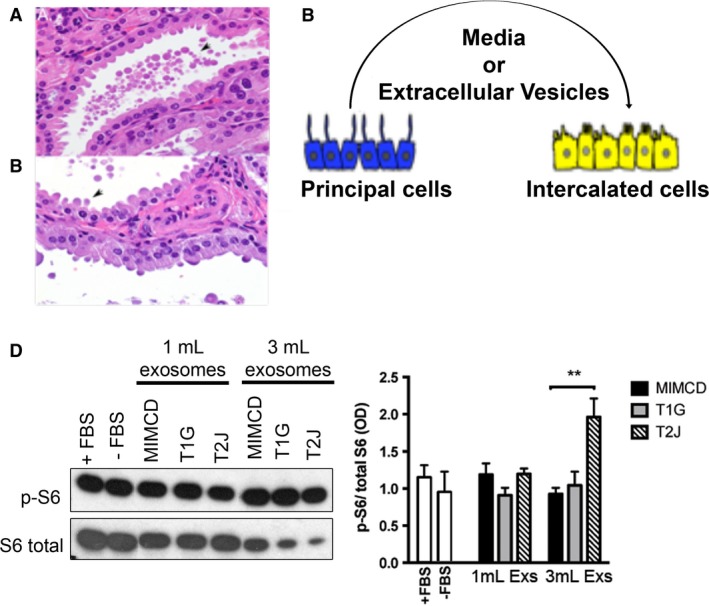
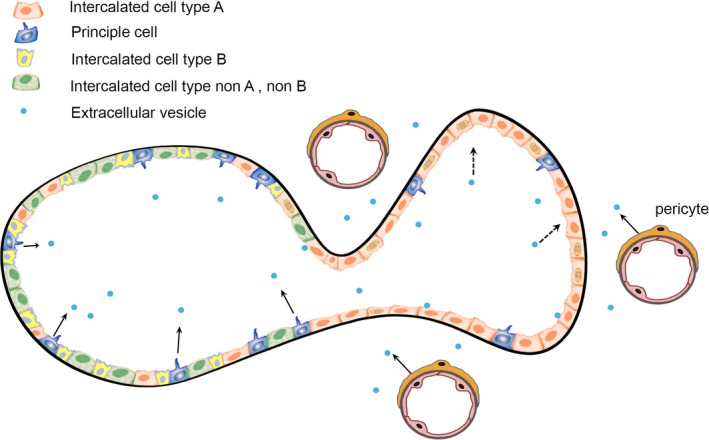
Tuberous sclerosis complex (TSC) is a tumor predisposition syndrome with significant renal cystic and solid tumor disease. While the most common renal tumor in TSC, the angiomyolipoma, exhibits a loss of heterozygosity associated with disease, we have discovered that the renal cystic epithelium is composed of type A intercalated cells that have an intact Tsc gene that have been induced to exhibit Tsc-mutant disease phenotype. This mechanism appears to be different than that for ADPKD. The murine models described here closely resemble the human disease and both appear to be mTORC1 inhibitor responsive. The induction signaling driving cystogenesis may be mediated by extracellular vesicle trafficking.

Keywords: Intercalated cells; Tuberous sclerosis complex; renal cystic disease; renal cystogenesis.


Figures

Figure 1
Figure 1
Tsc renal cystic disease. (A) AqpCreTsc2 kidneys at 11 weeks with significant renal cystic disease. (B) Coronal sections of the kidney in figure A. (C) Mouse kidneys from RenCreTsc1 mouse with unilateral cystic disease. These are on the same size scale as in A. (D) Coronal section of kidney in figure C.
Figure 2
Figure 2
Cystic epithelium express tuberin and have not undergone Cre mediated recombination. (A) Western blot of hamartin and tuberin expression in IMCD cells and derived hamartin‐ (T1G and T1H) and tuberin‐knockdown cells (T2H ad T2J). Knock‐down of hamartin is known to reduce tuberin expression (Barone et al. 2018). (B) Section of mutant kidney cortex and medulla. While the principal cells should express aquaporin‐2 and not tuberin, other cells that do not express aquaporin‐2 should maintain tuberin expression. Cystic epithelium was restricted to the cortex and continued to express tuberin (yellow arrows). At higher magnifications (63X) some aquaporin expressing cells were identified (white arrows). The medullary cells, believed to be medullary collecting ducts, robustly expressed aquaporin‐2. (C) Cystic epithelium exhibits a PCR band that is the correct size for the non‐recombined loxP2 site. (D) Sequencing these bands reveal that they contain the loxP2 site indicating that they did not undergo Cre mediated recombination.
Figure 3
Figure 3
The Tsc1 gene has not undergone recombination in the cystic epithelium of the Ren1cCreTsc1 model. (A) Brightfield of Ren‐1c‐CreTsc1 kidney arteriole, denoted by “v”, and cysts, denoted by “c”. (B) Fluorescence of the same tissue in panel A demonstrating vascular pericyte derived fluorescence, while cysts are devoid of signal. (C) Brightfield of arteriole and cysts. (D) Fluorescence of tissue in C with only vessel fluorescing.
Figure 4
Figure 4
Cyst epithelial phenotypes in AqpCreTsc2 mice. (A) DBA staining in cyst epithelia in AqpCreTsc2 (Tsc‐2 KO) mice. (B) Expression of AQP‐2 in kidneys of WT (left) and AqpCreTsc2 (Tsc‐2 KO) mice (right). (C) Double immunofluorescence labeling with AQP‐2 (green) and H+ATPase (red) antibodies in normal kidney (merged image). (D) Double immunofluorescent labeling with AQP‐2 (green) and H+ATPase (red) in kidneys of 5 weeks (left panel) and 11 weeks old (right panel) AqpCreTsc2 mice (merged image). (E) Expression of prorenin receptor (PRR) in kidneys of AqpCreTsc2 mouse. Left panel: normal kidney; Middle panel: 5 weeks old AqpCreTsc2 mice. Right panel: 11 weeks old AqpCreTsc2 mice. (F) Double immunofluorescent labeling with NBC‐e1 (right panel) and H+ATPase B subunit (left panel) in kidneys of 11 weeks old AqpCreTsc2 mice. (G) Cyst double labeling with H+ATPase (green arrow) and AE‐1 (red arrow), additional evidence that cystic epithelium consists of type A intercalated cells. (H) Double immunofluorescence labeling with H+ATPase and AQP‐2 in kidneys of Pkd1 mouse (merged image). (I) PCR products of female mouse pgk‐1 promoter region on the X chromosome, for undigested sample, U, methyl‐dependent Hpa II digested, H, and methyl‐independent MspI digested samples from WT and AqpCreTsc2 mice. Cystic cell DNA is not clonal as band intensity is diminished by > 25% when input DNA is pre‐digested with Hpa II. C: cyst, G: Glomerulus
Figure 5
Figure 5
AqpCreTsc2 cystic epithelium exhibit much fewer primary cilia than adjacent tubules. (A) Immunofluorescence of acetylated tubulin (yellow arrow) easily identify primary cilia in a medullary collecting duct. (B‐D) Cystic epithelium exhibit a significant suppression of primary cilia (white arrow) but does exhibit occasional cilia (yellow arrow).
Figure 6
Figure 6
Cyst epithelial phenotypes in Ren1cCreTsc1 mice. (A) DBA staining in cyst epithelia in Ren‐1c‐ CreTsc1 (Tsc‐1 KO) mice. (B) Expression of AQP‐2 in kidneys of WT and Ren1cCreTsc1 mice. (C) Double immunofluorescence labeling (merged image) with H+ATPase (green) and NBC‐e1 (red) antibodies in normal kidney (left) and adult Ren1cCreTsc1 mice (right). (D) Expression of PRR in kidneys of Ren1cCreTsc1 mice. (E) Double immunofluorescence labeling with Na+‐K+ ATPase (green) and NBC‐e1 (red) in normal kidney (first and third panels) and Ren1cCreTsc mice (second and fourth panels). (F) Double immunofluorescence labeling with H+ATPase (red) and PCNA (Proliferating Cell Nuclear Antigen) antibodies (merged image) in kidneys WT, AqpCreTsc2, RenCreTsc1, and Pkd1 mice.
Figure 7
Figure 7
mTORC1 involved in cystic disease. (A) AqpCreTsc2 cysts stain robustly for phospho‐S6 (bar is 50 μm). (B) RenCreTsc1 cysts also stain robustly for phospho‐S6 (bar is 1000 μm). (C) mTORC1 inhibition significantly prolongs AqpCreTsc2 survival compared to sham treated (P = 0.0293) (n = 5 mice each group). (D) mTORC1 inhibition also significantly prolongs RenCreTsc1 survival compared to sham‐treated animals (P < 0.0001) (n = 10 mice each group).
Figure 8
Figure 8
Human Polycystic variety of TSC renal Disease. (A) Human polycystic kidney variety of TSC renal disease at nephrectomy. (B) Cyst epithelium from kidney in panel A exhibiting apical staining with H+ATPase antibody (bar is 100 μm). (C) Biopsy specimen from patient with TSC‐related microcystic disease exhibiting apical staining with H+ATPase antibody (bar is 100 μm). (D) MRI imaging (T2 fast spin echo with fat suppression) from patients with TSC cystic disease (white lesions in solitary left kidney) before mTORC1 inhibitor therapy, (E) Patient in panel “D” after one year on drug. (F) Analysis of total kidney cyst count from five patients with cortical cystic disease and focal cystic disease before and after mTORC1 therapy.
Figure 9
Figure 9
Inner medullary collecting duct (principal) cells produce extracellular vesicle that induce intercalated cell mTORC1 signaling. (A) Microscopic cyst containing extracellular vesicles in lumen (arrow). (B) Extracellular vesicles either budding from or fusing with apical epithelial cell surface (arrow). (C) Diagram of experimental design. Intercalated cells were exposed to principal cell derived conditioned media or isolated extracellular vesicles. (D) Western blot of phospho‐S6 and S6 in cultured intercalated cells. To calibrate experiment, intercalated cells were exposed to FBS or serum starvation (FBS‐), or isolated extracellular vesicles from 1 mL (ECV‐1) or 3 mL (EVC‐3) of the corresponding conditioned media. ** Student t test P < 0.01.IMCD cells, derived hamartin‐ (T1G and T1H) and tuberin‐knockdown cells (T2H ad T2J). Bar diagram shows optical density of three independent experiments (Mean ± SEM).
Figure 10
Figure 10
Model of TSC Cystogenesis. Cortical collecting duct contains three types of intercalated cells (see color key) and principal cells that express cilia (blue). Stimulation initiated from either the mutant principal cells or the mutant vascular pericytes (arrows), drive the type A intercalated cells to adopt a mutant phenotype and proliferate (dashed arrows).

References

    1. Armour, E. A. , Carson R. P., and Ess K. C.. 2012. Cystogenesis and elongated primary cilia in Tsc1‐deficient distal convoluted tubules. Am. J. Physiol. Renal Physiol. 303:F584–F592. - PMC - PubMed
    1. Arulrajah, S. , Ertan G., Jordan L., Tekes A., Khaykin E., Izbudak I., et al. 2009. Magnetic resonance imaging and diffusion‐weighted imaging of normal‐appearing white matter in children and young adults with tuberous sclerosis complex. Neuroradiology 51:781–786. - PubMed
    1. Badenas, C. , Torra R., Perez‐Oller L., Mallolas J., Talbot‐Wright R., Torregrosa V., et al. 2000. Loss of heterozygosity in renal and hepatic epithelial cystic cells from ADPKD1 patients. Eur. J. Hum. Genet. 8:487–492. - PubMed
    1. Barone, S. , Xu J., Zahedi K., Brooks M., and Soleimani M.. 2018. Probenecid pre‐treatment downregulates the kidney Cl(‐)/HCO3(‐) exchanger (pendrin) and potentiates hydrochlorothiazide‐induced diuresis. Front. Physiol. 9:849. - PMC - PubMed
    1. Benvenuto, G. , Li S., Brown S. J., Braverman R., Vass W. C., Cheadle J. P., et al. 2000. The tuberous sclerosis‐1 (TSC1) gene product hamartin suppresses cell growth and augments the expression of the TSC2 product tuberin by inhibiting its ubiquitination. Oncogene 19:6306–6316. - PubMed

Publication types

MeSH terms

Substances