. 2019 Feb 21;4(4):e124522.
doi: 10.1172/jci.insight.124522.

Long noncoding RNA Malat1 regulates differential activation of macrophages and response to lung injury

Affiliations

Long noncoding RNA Malat1 regulates differential activation of macrophages and response to lung injury

Huachun Cui et al. JCI Insight. .

Abstract

Macrophage activation, i.e., classical M1 and the alternative M2, plays a critical role in many pathophysiological processes, such as inflammation and tissue injury and repair. Although the regulation of macrophage activation has been under extensive investigation, there is little knowledge about the role of long noncoding RNAs (lncRNAs) in this event. In this study, we found that lncRNA Malat1 expression is distinctly regulated in differentially activated macrophages in that it is upregulated in LPS-treated and downregulated in IL-4-treated cells. Malat1 knockdown attenuates LPS-induced M1 macrophage activation. In contrast, Malat1 knockdown enhanced IL-4-activated M2 differentiation as well as a macrophage profibrotic phenotype. Mechanistically, Malat1 knockdown led to decreased expression of Clec16a, silencing of which phenocopied the regulatory effect of Malat1 on M1 activation. Interestingly, Malat1 knockdown promoted IL-4 induction of mitochondrial pyruvate carriers (MPCs) and their mediation of glucose-derived oxidative phosphorylation (OxPhos), which was crucial to the Malat1 regulation of M2 differentiation and profibrotic phenotype. Furthermore, mice with either global or conditional myeloid knockout of Malat1 demonstrated diminished LPS-induced systemic and pulmonary inflammation and injury. In contrast, these mice developed more severe bleomycin-induced lung fibrosis, accompanied by alveolar macrophages displaying augmented M2 and profibrotic phenotypes. In summary, we have identified what we believe is a previously unrecognized role of Malat1 in the regulation of macrophage polarization. Our data demonstrate that Malat1 is involved in pulmonary pathogeneses in association with aberrant macrophage activation.

Keywords: Cellular immune response; Fibrosis; Immunology; Macrophages; Pulmonology.


Conflict of interest statement

Conflict of interest: The authors declare that no conflict of interest exists.

Figures

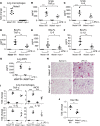
Figure 1
Figure 1. lncRNA Malat1 expression undergoes distinct alteration in differentially activated macrophages.
(A) Mouse BMDMs were treated with 100 ng/ml LPS for the indicated duration of time. Total RNAs were isolated and levels of Malat1 determined by real-time PCR. n = 4; mean ± SD; *P < 0.05, **P < 0.01 compared with time “0”. (B) Human PBMC-derived macrophages were treated with 100 ng/ml LPS for the indicated duration of time. Levels of Malat1 were determined. n = 4; mean ± SD; **P < 0.01 compared with time “0”. (C) Human THP-1–derived macrophages were treated with 100 ng/ml LPS for the indicated duration of time. Levels of Malat1 were determined. n = 3; mean ± SD; *P < 0.05 compared with time “0”. (D) BMDMs were treated with or without 100 ng/ml LPS for 1 hour. ChIP assay was performed. Levels of p65 binding to the Malat1 promoter were determined by real-time PCR. n = 3; mean ± SD; ***P < 0.001 compared with “–LPS”. (E) BMDMs were treated with 5 ng/ml mouse IL-4 for the indicated duration of time. Levels of Malat1 were determined. n = 4; mean ± SD; **P < 0.01 compared with time “0”. (F and G) BMDMs were treated with or without 100 ng/ml LPS for 6 hours or 5 ng/ml IL-4 for 24 hours. Cell fractionation was performed, and RNAs in the cytoplasmic and nuclear fractions were isolated. Levels of tubulin α1 and Sno-142 (F), and Malat1 (G) in each fraction were determined by real-time PCR. n = 3; mean ± SD; **P < 0.01, ***P < 0.001. Two-tailed Student’s t test was used (AG) to analyze statistical significance. Representative of 2 to 3 independent experiments.
Figure 2
Figure 2. Malat1 knockdown attenuates proinflammatory activation of macrophages.
(A) BMDMs were transfected with 20 nM control (con) GapmeR or Malat1 GapmeR. Forty-eight hours after transfection, the cells were treated with or without 100 ng/ml LPS for 6 hours. Total RNAs were isolated and levels of Malat1 determined by real-time PCR. n = 4; mean ± SD. (B and C) Experiments were performed as in A. mRNA (B) and protein (C) levels of the indicated proinflammatory cytokines were determined by real-time PCR or ELISA. n = 3–4; mean ± SD. (D) Experiments were performed as in A. Bacterial killing assay was performed as described in Methods. n = 3; mean ± SD. *P < 0.05; **P < 0.01; ***P < 0.001 by 1-way ANOVA with Bonferroni’s post hoc test (AD). Representative of more than 3 independent experiments.
Figure 3
Figure 3. Malat1 regulates the expression of C-type lectin domain family 16, member A (Clec16a), which is required for the proinflammatory activation of macrophages.
(A) BMDMs were transfected with 20 nM control (con) GapmeR or Malat1 GapmeR. Forty-eight hours after transfection, the cells were treated with or without 100 ng/ml LPS for 6 hours. Total RNAs were isolated and levels of Clec16a determined by real-time PCR. n = 3; mean ± SD; *P < 0.05, ***P < 0.001, one-way ANOVA with Bonferroni’s test. (BD) BMDMs (B), human PBMC-derived macrophages (C), and THP-1–derived macrophages (D) were treated with 100 ng/ml LPS for the indicated duration of time. Levels of Clec16a and Malat1 were determined by real-time PCR. n = 3–4; mean ± SD; *P < 0.05, **P < 0.01, ***P < 0.001, #P < 0.05, ##P < 0.01 compared with respective levels at time “0”, 2-tailed Student’s t test. (E and F) BMDMs were transfected with 20 nM con siRNA (open bar) or Clec16a siRNA (closed bar). Forty-eight hours after transfection, the cells were treated with or without 100 ng/ml LPS for 6 hours. mRNA (E) or protein (F) levels of the indicated genes were determined by real-time PCR or ELISA. n = 3; mean ± SD; *P < 0.05, **P < 0.01 compared with the “con si” group, 2-tailed Student’s t test. (G) BMDMs were cotransfected with con siRNA, con GapmeR, Clec16a siRNA, and Malat1 GapmeR, in combination as indicated. Forty-eight hours after transfection, the cells were treated with or without 100 ng/ml LPS for 6 hours. Levels of the indicated genes were determined by real-time PCR. n = 4; mean ± SD; *P < 0.05, ***P < 0.001, one-way ANOVA with Bonferroni’s test. Representative of 2 independent experiments.
Figure 4
Figure 4. Myeloid ablation of Malat1 (Malat1 mye–/–) attenuates LPS-induced ALI.
(A) Alveolar macrophages were harvested from BALFs of Malat1fl/fl and Malat1 mye–/– mice. Levels of Malat1 in the cells were determined by real-time PCR. n = 6 each for Malat1fl/fl and Malat1 mye–/– mice; mean ± SE. (B and C) Malat1fl/fl and Malat1 mye–/– mice were i.t. instilled with 50 μl saline or 5 mg/kg LPS in 50 μl saline. Forty-eight hours after administration, mice were sacrificed and lung homogenates prepared. Levels of the indicated proinflammatory cytokines were determined by ELISA. n = 3, 6, 5, 6 mice for each group; mean ± SE. (DF) Experiments were performed as in B and C. BALF levels of the indicated proinflammatory cytokines were determined by ELISA. n = 4, 6, 3, 6 mice for each group; mean ± SE. (G) Experiments were performed as in B and C. Levels of lung MPO were determined by ELISA. n = 3, 6, 5, 5 mice for each group; mean ± SE. (H) Experiments were performed as in B and C. H&E staining was performed. Original magnification, ×10. Scale bars: 200 μm. (I) Experiments were performed as in B and C. Twenty-four hours after administration, alveolar macrophages were harvested and mRNA levels of the indicated genes determined by real-time PCR. ● Malat1fl/fl saline, ■ Malat1fl/fl LPS, ▲ Malat1 mye–/– saline, ▼ Malat1 mye–/– LPS; n = 6, 4, 6, 4 mice for each group; mean ± SE. (J) Experiments were performed as in B and C. Twenty-four hours after administration, alveolar macrophages were harvested and mRNA levels of Clec16a determined. n = 4, 4 mice for each group; mean ± SE. *P < 0.05; **P < 0.01; ***P < 0.001 by 1-way ANOVA with Bonferroni’s post hoc test (BI) or 2-tailed Student’s t test (J).
Figure 5
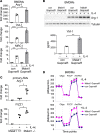
Figure 5. Malat1 knockdown promotes alternative activation of macrophages.
(A) BMDMs were transfected with 20 nM control (con) GapmeR or Malat1 GapmeR. Forty-eight hours after transfection, the cells were treated with or without 5 ng/ml IL-4 for 24 hours. Levels of the indicated genes were determined by real-time PCR. n = 4; mean ± SD. (B) Experiments were performed as in A. Levels of Arg-1 and YM-1 were determined by Western blotting or ELISA. n = 3; mean ± SD. (C) Malat1fl/fl and Malat1 mye–/– mice were i.t. instilled with IL-4 (1 μg)/anti–IL-4 antibody (5 μg) immunocomplex (IL-4c) in 50 μl saline. Twenty-four hours after administration, alveolar macrophages were harvested and levels of the indicated genes determined. n = 2, 3, 3 mice for each group; mean ± SE. (D) BMDMs were transfected with 20 nM con GapmeR or Malat1 GapmeR. Twenty-four hours after transfection, the cells were trypsinized and plated on Seahorse XF-24 microplates. Twenty-four hours after plating, the cells were treated without (top) or with (bottom) 5 ng/ml IL-4 for 24 hours. The media were then replaced with OCR assay media and cultured for 1 hour, followed by sequential treatments with 3 μg/ml oligomycin (Oligo), 6 μM FCCP, and 1 μM rotenone (Rot) plus 0.5 μM antimycin A (Ant). Real-time OCR was recorded. n = 5 for each condition; mean ± SE. Representative of 2 to 4 independent experiments. *P < 0.05; **P < 0.01; ***P < 0.001 by 1-way ANOVA with Bonferroni’s post hoc test.
Figure 6
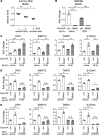
Figure 6. Malat1 regulation of alternative activation of macrophages is dependent on glucose metabolism.
(A) BMDMs were transfected with 20 nM control (con) GapmeR or Malat1 GapmeR. Forty-eight hours after transfection, the cells were pretreated with vehicle or 2 mM 2-DG for 1 hour, followed by treatment with 5 ng/ml IL-4 for 12 hours. Levels of the indicated M2 markers were determined by real-time PCR. n = 4; mean ± SD. (B) BMDMs were transfected with 20 nM con GapmeR or Malat1 GapmeR. Forty-eight hours after transfection, the cells were treated with or without 5 ng/ml IL-4 for 12 hours. Levels of MPC1 and MPC2 were determined by real-time PCR. n = 4; mean ± SD. (C and D) The experiments were performed as in A, except that the cells were pretreated with vehicle, 50 μM UK-5099 (C), or 200 nM rotenone (D) for 1 hour. n = 3–4; mean ± SD. *P < 0.05; **P < 0.01; ***P < 0.001 by 1-way ANOVA with Bonferroni’s post hoc test (AD). Representative of 2 to 4 independent experiments.
Figure 7
Figure 7. Malat1 knockdown promotes profibrotic differentiation of macrophages.
(A) Wide-type mice were i.t. instilled with 50 μl saline or 1.5 U/kg bleomycin (BLM) in 50 μl saline. Three weeks after bleomycin administration, BAL cells were collected and resident and recruited alveolar macrophages were sorted as described in Methods. Levels of Malat1 were determined by real-time PCR. n = 3, 3 mice for each group; mean ± SE. (B and C) BMDMs were transfected with 20 nM control (con) GapmeR or Malat1 GapmeR. Forty-eight hours after transfection, the cells were treated for 48 hours with BALFs from mice that were treated i.t. with saline or 1.5 U/kg bleomycin for 3 weeks. Levels of the indicated genes were determined by real-time PCR. n = 4; mean ± SD. (D and E) BMDMs were transfected with 20 nM con GapmeR or Malat1 GapmeR. Forty-eight hours after transfection, the cells were pretreated with vehicle, 2 mM 2-DG (D), or 50 μM UK-5099 (E) for 1 hour, followed by treatment with BALFs from mice that were treated i.t. with saline or 1.5 U/kg bleomycin for 3 weeks. Levels of the indicated profibrotic markers were determined by real-time PCR and normalized to the group of cells treated with con GapmeR and saline BALF. n = 3; mean ± SD. *P < 0.05; **P < 0.01; ***P < 0.001 by 1-way ANOVA with Bonferroni’s post hoc test (AE). Representative of 2 independent experiments.
Figure 8
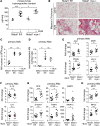
Figure 8. Myeloid ablation of Malat1 promotes bleomycin-induced pulmonary fibrosis.
(A) Malat1fl/fl and Malat1 mye–/– mice were i.t. instilled with 50 μl saline or 1.5 U/kg bleomycin (BLM) in 50 μl saline. Three weeks after bleomycin administration, mice were sacrificed and lung homogenates prepared. Levels of hydroxyproline in the whole lungs were determined. n = 3, 9, 4, 10 mice for each group; mean ± SE. (B) The experiments were performed as in A. Lungs were fixed with 10% formalin and sections prepared. Masson’s trichrome staining was performed. Original magnification, ×20. Scale bars: 100 μm. (C and D) The experiments were performed as in A. BAL cells were collected and resident and recruited macrophages sorted. Total alveolar macrophage numbers (C) and relative numbers of resident and recruited macrophages (D) were determined. n = 3, 3, 3 mice for each group; mean ± SE. (EH) The experiments were performed as in A. BALFs were prepared and alveolar macrophages in the BALFs harvested. Levels of the indicated genes in the cells were determined by real-time PCR. ● Malat1fl/fl BLM, ▲ Malat1 mye–/– BLM; n = 9 mice for each group; mean ± SE. *P < 0.05; **P < 0.01; ***P < 0.001 by 1-way ANOVA with Bonferroni’s post hoc test (A, CH).

Similar articles

Cited by

References

    1. Lawrence T, Natoli G. Transcriptional regulation of macrophage polarization: enabling diversity with identity. Nat Rev Immunol. 2011;11(11):750–761. doi: 10.1038/nri3088. - DOI - PubMed
    1. Murray PJ, Wynn TA. Obstacles and opportunities for understanding macrophage polarization. J Leukoc Biol. 2011;89(4):557–563. doi: 10.1189/jlb.0710409. - DOI - PMC - PubMed
    1. Mosser DM, Edwards JP. Exploring the full spectrum of macrophage activation. Nat Rev Immunol. 2008;8(12):958–969. doi: 10.1038/nri2448. - DOI - PMC - PubMed
    1. Sica A, Mantovani A. Macrophage plasticity and polarization: in vivo veritas. J Clin Invest. 2012;122(3):787–795. doi: 10.1172/JCI59643. - DOI - PMC - PubMed
    1. Gordon S, Martinez FO. Alternative activation of macrophages: mechanism and functions. Immunity. 2010;32(5):593–604. doi: 10.1016/j.immuni.2010.05.007. - DOI - PubMed

Publication types

MeSH terms