Review
. 2019 Mar 4;48(5):1362-1389.
doi: 10.1039/c8cs00155c.

Multifunctional porous hydrogen-bonded organic framework materials

Affiliations
Review

Multifunctional porous hydrogen-bonded organic framework materials

Rui-Biao Lin et al. Chem Soc Rev. .

Abstract

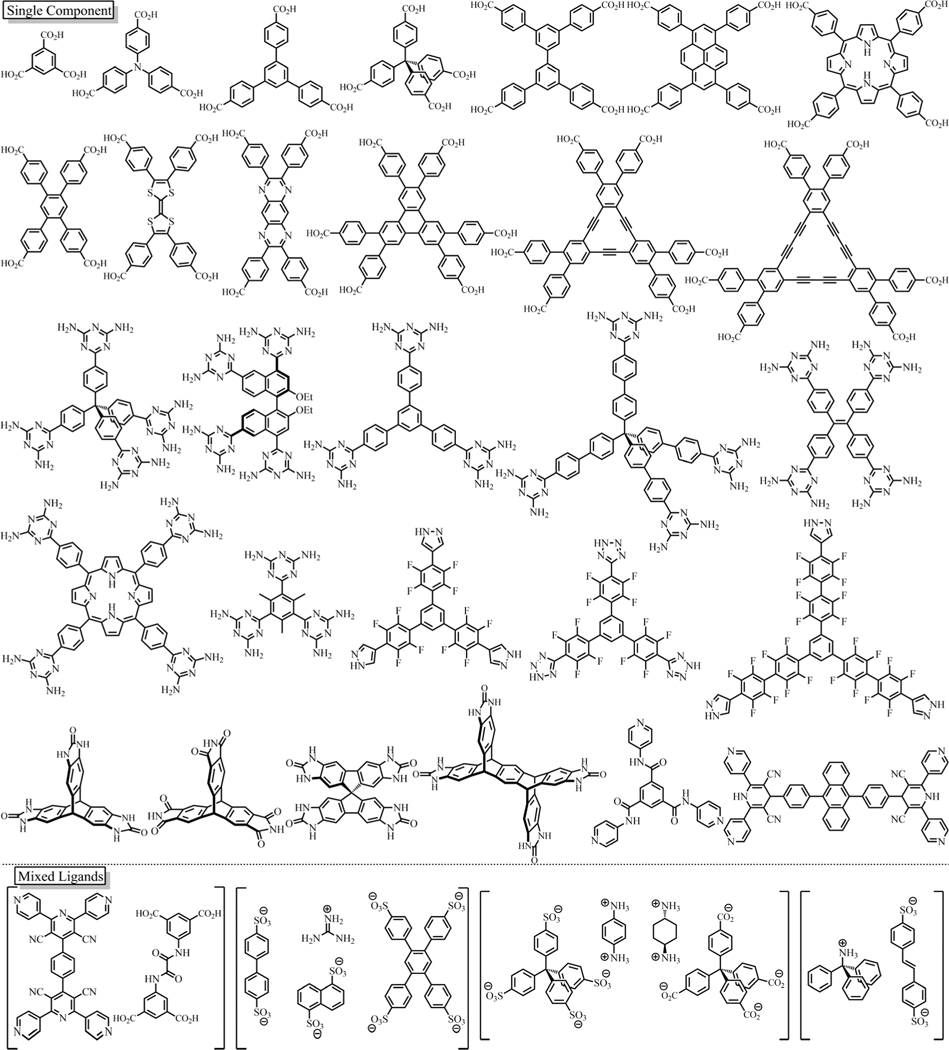
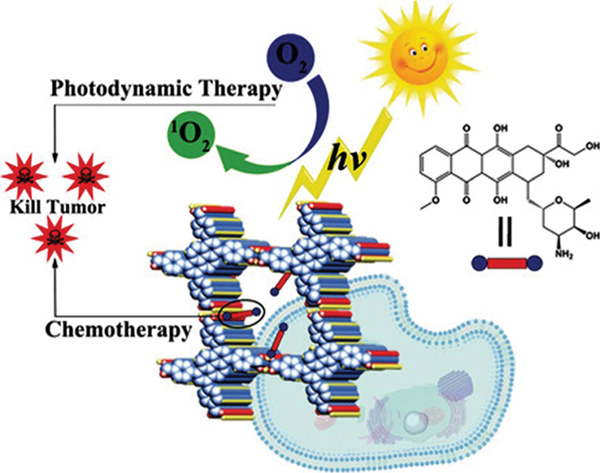
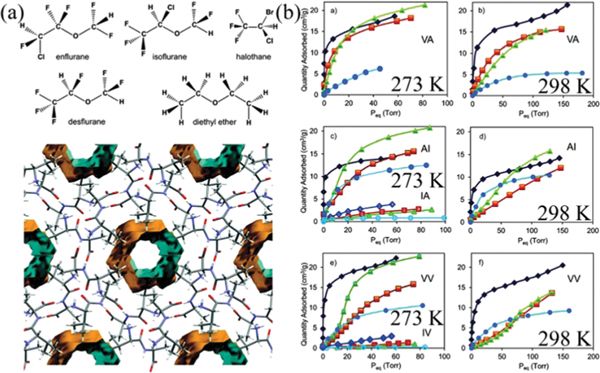
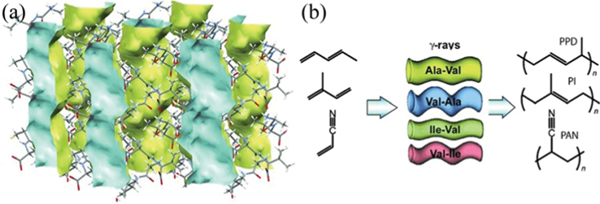
Hydrogen-bonded organic frameworks (HOFs) represent an interesting type of polymeric porous materials that can be self-assembled through H-bonding between organic linkers. To realize permanent porosity in HOFs, stable and robust open frameworks can be constructed by judicious selection of rigid molecular building blocks and hydrogen-bonded units with strong H-bonding interactions, in which the framework stability might be further enhanced through framework interpenetration and other types of weak intermolecular interactions such as ππ interactions. Owing to the reversible and flexible nature of H-bonding connections, HOFs show high crystallinity, solution processability, easy healing and purification. These unique advantages enable HOFs to be used as a highly versatile platform for exploring multifunctional porous materials. Here, the bright potential of HOF materials as multifunctional materials is highlighted in some of the most important applications for gas storage and separation, molecular recognition, electric and optical materials, chemical sensing, catalysis, and biomedicine.


Conflict of interest statement

Conflicts of interest

There are no conflicts to declare.

Figures

Fig. 1
Fig. 1
Various types of hydrogen bonds. This sketch is not exactly quantitative but the coloring attempts to give a visual scale of bonding energies. Data from Steiner’s paper.
Fig. 2
Fig. 2
Distributions of (a) O–HO and N–HO bond-length and (b) corresponding directionality, based on analyses of crystal structures from the Cambridge Structural Database with updates by August 2018. Structures obtained from the database were applied with a bonding cutoff of 3.04 (for O–HO) and 3.07 Å (for N–HO), i.e. the sum of van der Waals radii. The bond angle cutoff is 4120°.
Fig. 3
Fig. 3
Various O/N containing organic groups for potential H-bonding units, including carboxylic acid, pyrazole, 2,4-diaminotriazine, amide, benzimidazolone, imide, imidazole, amidinium, and so on.
Fig. 4
Fig. 4
The geometry of typical H-bonding units assembled from common organic groups through multiple intermolecular H-bonds, serving as the building blocks for HOF construction.
Fig. 5
Fig. 5
Schematic representation of various organic ligands for the construction of HOFs. Roughly categorized based on the types of components.
Fig. 6
Fig. 6
The cage structure of methane clathrate (Structure I). Structure from Ojamäe.
Fig. 7
Fig. 7
(a) The 3D porous structure of SOF-1 with 1D channels. (b) Comparison of gas adsorption on SOF-1a. C2H2 (black), CO2 (red), CH4 (blue), and N2 (magenta) at 195 K (triangles), 270 (or 273) K (circles) and 298 K (stars). Reprinted with permission. Copyright 2010 American Chemical Society.
Fig. 8
Fig. 8
(a) Schematic diagram of the structure of triptycene trisbenzimidazolone (TTBI). (b) Nitrogen sorption isotherm of activated TTBI at 77 K. The inset shows the measured pore-size distribution. Reproduced with permission. Copyright 2012 Wiley-VCH.
Fig. 9
Fig. 9
Crystal structures and gas adsorption isotherms for polymorphs of T2. (a) Overlays of predicted (red) and experimental (blue) structures for T2-γ, T2-α and T2-β, ordered by increasing predicted density. The transformation conditions for interconverting these polymorphs were as follows: (A) loss of solvent at room temperature, heating at 340 K or mechanical grinding at room temperature; (B) heating at 358–383 K. (b) Nitrogen isotherms (77 K); (c) methane isotherms (115 K); filled circles, adsorption experiments; unfilled circles, desorption experiments; filled triangles, adsorption simulations. Reprinted with permission. Copyright 2017 Nature Publishing Group.
Fig. 10
Fig. 10
(a) The crystal structure of IISERP-HOF1 with 1D channels. (b) N2 and CO2 isotherms of IISERP-HOF1. (c) The IAST plots of IISERP-HOF1 for the 15 : 85 CO2/N2 mixture. The inset shows the HOA plot calculated using virial methods. Reproduced with permission. Copyright 2016, Royal Society of Chemistry.
Fig. 11
Fig. 11
(a) Crystal structure of HOF-8, showing a 2D supermolecular layer. (b) N2, H2, and CO2 sorption isotherms for HOF-8d at 298 K. Reprinted with permission. Copyright 2013 American Chemical Society.
Fig. 12
Fig. 12
(a) Views of the paddle-wheel complexes and the assembled networks along the crystallographic [001] axis in MPM-1-TIFSIX. (b) Low-pressure CO2, CH4, and N2 isotherms collected at 298 K and (inset) CO2 Qst for MPM-1-TIFSIX. (c) IAST selectivities for 50 : 50 CO2/CH4 (green; left ordinate) and 10 : 90 CO2/N2 (blue; right ordinate) binary mixtures predicted at 298 K for MPM-1-TIFSIX. Reprinted with permission. Copyright 2013 American Chemical Society.
Fig. 13
Fig. 13
(a) The 3D porous structure of SOF-7 with 1D channels viewed from the crystallographic [100] axis. (b) CO2 and CH4 isotherms for SOF-7a at 273 K and 298 K in the pressure range 0–20 bar. Reprinted with permission. Copyright 2014 American Chemical Society.
Fig. 14
Fig. 14
(a) Schematic diagram of structural transformation from HOF-5 to HOF-5a and (b) CO2 sorption in the pore structure of HOF-5a. Reprinted with permission. Copyright 2015 American Chemical Society.
Fig. 15
Fig. 15
(a) The 3D porous structure of HOF-7 viewed from the crystallographic [100] axis. (b) Gas sorption isotherms of HOF-7a (solid symbols: adsorption; open symbols: desorption). Reprinted with permission. Copyright 2015 American Chemical Society.
Fig. 16
Fig. 16
(a) The X-ray crystal structure of HOF-1 showing 1D channels along the crystallographic [001] axis. (b) The bcu network topology of HOF-1. (c) CO2 sorption isotherm at 196 K and (d) C2H2 and C2H4 sorption isotherms at 273 K. Reprinted with permission. Copyright 2011 American Chemical Society.
Fig. 17
Fig. 17
(a) The X-ray crystal structure of HOF-3 in three-dimensional packing showing the 1D hexagonal channels of about 7.0 Å in diameter along the crystallographic [001] axis. (b) Sorption isotherms of C2H2 and CO2 of HOF-3a at 296 K. (c) Comparison of the heat of adsorption of C2H2 in HOF-3a and various MOFs. (d) IAST adsorption selectivities of C2H2/CO2 in an equimolar mixture in HOF-3a and various MOFs at 296 K. (e) Experimental column breakthrough curve for an equimolar C2H2/CO2 mixture (296 K, 1 bar) in an adsorber bed packed with HOF-3a. Reproduced with permission. Copyright 2015 Wiley-VCH.
Fig. 18
Fig. 18
(a) The X-ray crystal structure of HOF-TCBP showing a 5-fold interpenetrated dia framework. (b) Connolly representation of the 1D channels along the crystallographic [100] axis. (b) Sorption isotherms of C2H2 and CO2 of HOF-3a at 296 K. (c and d) The sorption isotherms of HOF-TCBP for the light hydrocarbons at 295 K. Reproduced with permission. Copyright 2017 Wiley-VCH.
Fig. 19
Fig. 19
(a) Neutron crystal structure of HOF-21a·C2D2 viewed along the crystallographic [001] axis. (b) Adsorption isotherms of C2H2 (solid) and C2H4 (hollow) on HOF-21a (blue) and MPM-1-TIFSIX (red) at 298 K. (c) Experimental column breakthrough curves for the 50 : 50 C2H2/C2H4 binary mixture at 298 K and 1 bar in an adsorber bed packed with HOF-21a (blue) or MPM-1-TIFSIX (red). The hollow dot is for C2H4, and the solid dot is for C2H2. Reprinted with permission. Copyright 2018 American Chemical Society.
Fig. 20
Fig. 20
(a) The X-ray crystal structure of fluorinated trispyrazole showing a hexagonal network, with infinite fluorine-lined channels protruding throughout the structure along the crystallographic [001] axis. (b) Gas sorption isotherms for N2, O2 and CO2. (c) Uptake of perfluorohexane as a function of time, upon exposure to the flow of C6F14-enriched nitrogen. Reprinted with permission. Copyright 2014 Nature Publishing Group.
Fig. 21
Fig. 21
(a) The 3D channel (orange/gray surfaces) defined by the hydrogen-bonded network and (b) the O2/Ar/N2 sorption isotherms at 77 K for trifluoromethyl benzotrisimidazole. The curves with solid symbols represent adsorption isotherms, while desorption isotherms are represented by open symbols. Reproduced with permission. Copyright 2016, Royal Society of Chemistry.
Fig. 22
Fig. 22
X-ray crystal structure of HOF-2 featuring (a) a three-dimensional hydrogen-bonded organic framework exhibiting 1D hexagonal pores along the crystallographic [001] axis and (b) the uninodal 6-connected network topology. X-ray crystal structure of HOF-2R-1-PEA indicating (c) the enantiopure R-1-PEA molecules residing in the channels of the framework along the crystallographic [001] axis and (d) the chiral cavities of the framework for the specific recognition of R-1-PEA. Comparison of X-ray crystal structures of (e) HOF-2⊂S-1-PEA and (f) HOF-2R-1-PEA. Reprinted with permission. Copyright 2014 American Chemical Society.
Fig. 23
Fig. 23
(a) Packing diagram of HOF-9 along the crystallographic [100] axis showing the pore surfaces of 1D channels highlighted as yellow/grey (inner/outer) curved planes; (b) a uninodal 6-connected α-Po net. (c) The crystal structure of HOF-9 ⊂ Py indicating the hydrogen-bonding interactions between Py and the HOF-9 framework (yellow dashed line), the ππ interaction between the DAT group and the Py molecule (red dashed line) and packed Py molecules residing in the channel of the framework along the crystallographic [100] axis. Reproduced with permission. Copyright 2017, Royal Society of Chemistry.
Fig. 24
Fig. 24
Illustration of fullerene molecules distributed in the channels of FDM-15. Reproduced with permission. Copyright 2017, Royal Society of Chemistry.
Fig. 25
Fig. 25
Schematic illustration of reversible single crystal–single crystal transformations based on the G4TSPB framework. Reprinted with permission. Copyright 2014 American Chemical Society.
Fig. 26
Fig. 26
(a) Methyl ,,12α-tris[(phenylaminocarbonyl)amino]--cholan-24-oate. (b) Interior surfaces of NPSU-3 viewed along the crystallographic [001] axis. (c) X-ray crystal structure of NPSU-3 with adsorbed aniline, viewed along the crystallographic [001] axis. The aniline is shown in the space-filling mode. (d) Optical crystals of NPSU-3 with included dyes upon polarized light irradiation. For each pair of images the plane of polarization is rotated through 90° between top and bottom. Reprinted with permission. Copyright 2013 American Chemical Society.
Fig. 27
Fig. 27
(a) X-ray crystal structure of HOF-6 indicating a 3D packing supramolecular structure along the crystallographic [101] direction with a channel size of 6.4 Å. (b) Nyquist plots of HOF-6a at 300 K (black), 303 K (red), 308 K (green), and 313 K (blue) at a relative humidity (RH) of 97%. Reprinted with permission. Copyright 2016 American Chemical Society.
Fig. 28
Fig. 28
(a and b) Hydrogen-bonded 2D frameworks of HOF-GS-10 and HOF-GS-11 showing the hydrogen-bonding interaction between the sulfonate groups and the guanidinium cations in both the compounds. (c) CO2 (dots), O2 (stars), and H2 (diamonds) adsorption isotherms of HOF-GS-10 at 195 K (CO2 and O2) and at 77 K (H2). (d) Proton conduction values of HOF-GS-10 and HOF-GS-11 at varying humidity and at 303 K. Reproduced with permission. Copyright 2016 Wiley-VCH.
Fig. 29
Fig. 29
(a) The 3D porous structure of CPOS-2 showing 1D channels and (b) temperature dependent proton conductivity of CPOS-2 at 98% RH. Reproduced with permission. Copyright 2018 Wiley-VCH.
Fig. 30
Fig. 30
(a) Crystal structures of H-HexNet motifs of Tp-1, T12-1, T18-1, and Ex-1. Normalized solid state fluorescence spectra of (b) Tp-apo (solid line) and Tp-2Ds (dashed line), (c) T12-apo (solid line) and T12-1 (dashed line), (d) T18-apo-II (solid line) and T18-1 (dashed line), and (e) Ex-apo (solid line) and Ex-1 (dashed line). Reprinted with permission. Copyright 2016 American Chemical Society.
Fig. 31
Fig. 31
(a) Packing diagram of CBPHAT-1. (b) Gas sorption isotherms of CBPHAT-1a: O2 (77 K), N2 (77 K), CO2 (195 K), H2 (77 K). (c) Emission spectra at different points of a CBPHAT-1a crystal. The inset shows an image of the crystal and the points of measurement. (d) Fluorescence decays of a CBPHAT-1a crystal at different spectral regions of the emission spectrum. Reproduced with permission. Copyright 2018 Wiley-VCH.
Fig. 32
Fig. 32
Schematic representation of the supramolecular architecture in MA-IPA showing ultralong organic phosphorescence. Reprinted with permission. Copyright 2018 American Chemical Society.
Fig. 33
Fig. 33
Schematic diagram of PFC-1 for synergetic chemo-photodynamic therapy by combining the delivery of doxorubicin and generation of singlet oxygen species. Reproduced with permission. Copyright 2018 Wiley-VCH.
Fig. 34
Fig. 34
(a) Chemical structures of the halogenated ethers used as guests (above); portion of the crystal structure of l-valyl-l-alanine (VA) along the channel axis (below). (b) Anesthetics adsorption isotherms in different dipeptides. Reproduced with permission. Copyright 2018, Royal Society of Chemistry.
Fig. 35
Fig. 35
(a) Crystal structure of the porous Ala-Val compound showing the empty channels along the crystallographic [001] axis in blue and yellow. (b) Schematic representation of the monomers and dipeptides used for the polymerization process. Reproduced with permission. Copyright 2012 Wiley-VCH.

References

    1. Davis ME, Nature, 2002, 417, 813. - PubMed
    1. Corma A, Chem. Rev, 1997, 97, 2373–2420. - PubMed
    1. Zhao D, Feng J, Huo Q, Melosh N, Fredrickson GH, Chmelka BF and Stucky GD, Science, 1998, 279, 548. - PubMed
    1. Li J, Corma A. and Yu J, Chem. Soc. Rev, 2015, 44, 7112–7127. - PubMed
    1. Furukawa H, Cordova KE, O’Keeffe M. and Yaghi OM, Science, 2013, 341, 1230444. - PubMed