

Axonal Anatomy Optimizes Spatial Encoding in the Rat Entorhinal-Dentate System: A Computational Study
- PMID: 30676938
- PMCID: PMC6642851
- DOI: 10.1109/TBME.2019.2894410
Axonal Anatomy Optimizes Spatial Encoding in the Rat Entorhinal-Dentate System: A Computational Study
Abstract
Objective: The network architecture connecting neural regions is defined by the organization and anatomical properties of the projecting axons, but its contributions to neural encoding and system function are difficult to study experimentally.
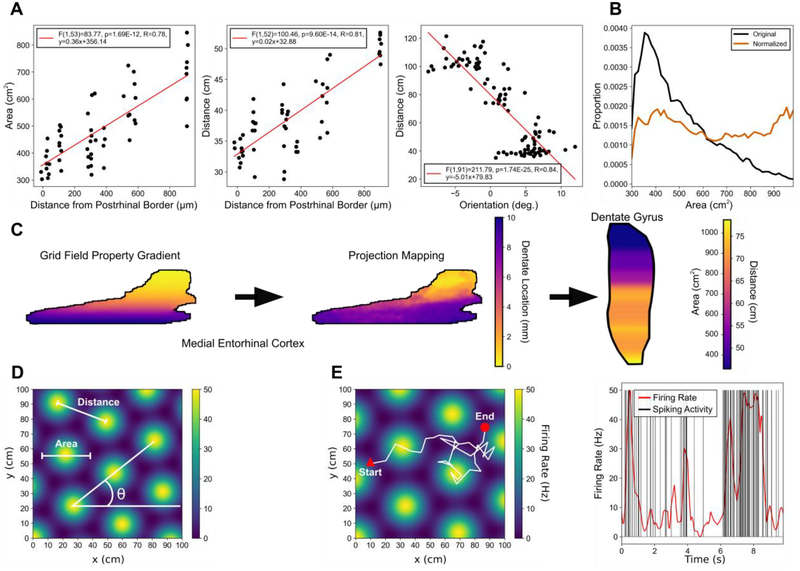
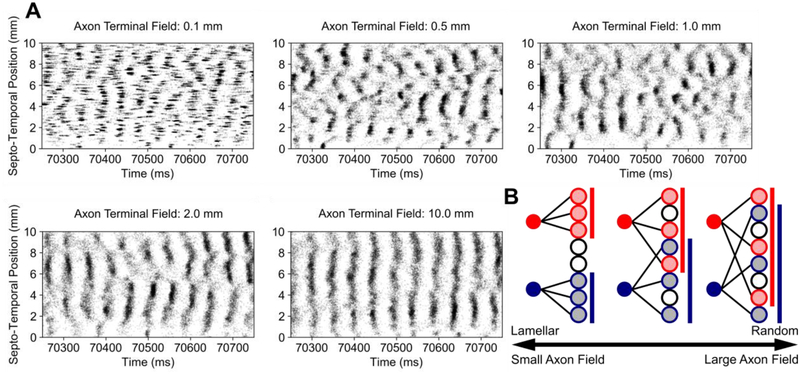
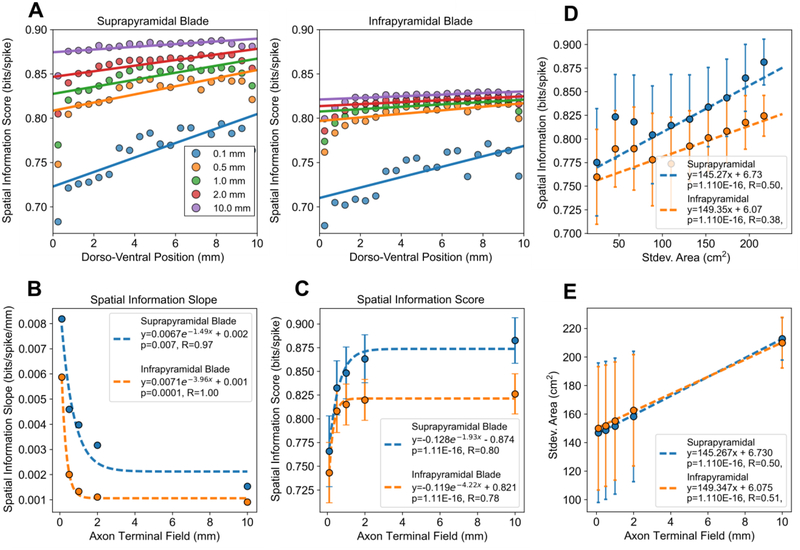
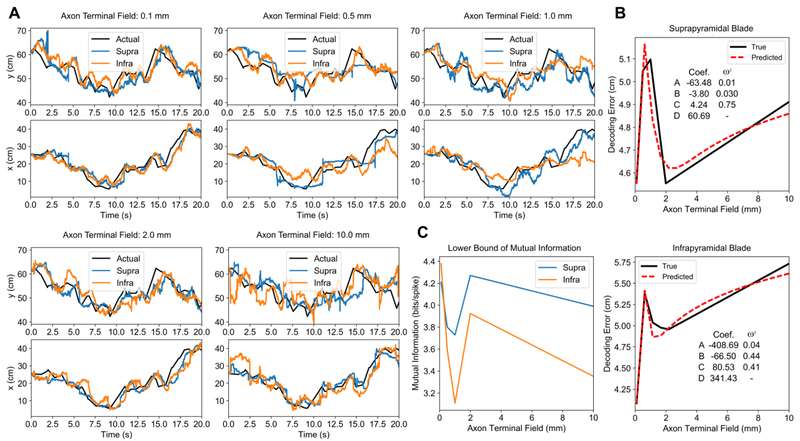
Methods: Using a large-scale, spiking neuronal network model of rat dentate gyrus, the role of the anatomy of the entorhinal-dentate axonal projection was evaluated in the context of spatial encoding by incorporating grid cell activity to provide physiological, spatially-correlated input. The dorso-ventral extents of the entorhinal axon terminal fields were varied to generate different feedforward architectures, and the resulting spatial representations and spatial information scores of the network were evaluated. Position was decoded from the population activity using a point process filter to investigate the contributions of network architecture on spatial encoding.
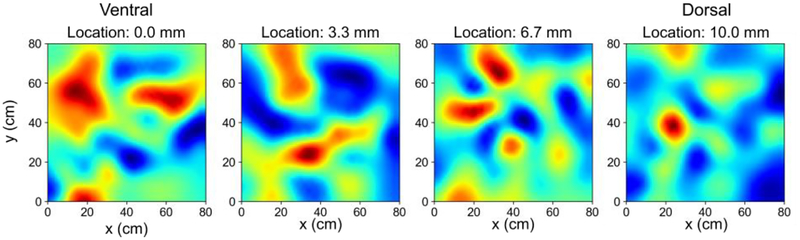
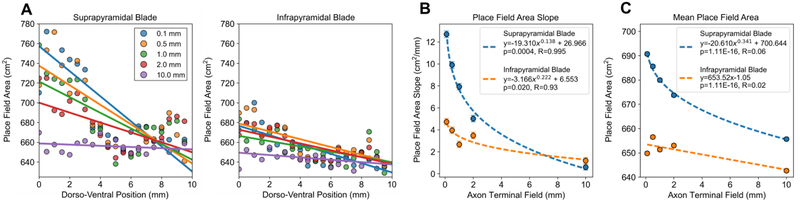
Results: The model predicted the emergence of anatomical gradients within the dentate gyrus for place field size and spatial information along its dorso-ventral axis, which were dependent on the extents of the entorhinal axon terminal fields. The decoding results revealed an optimal performance at an axon terminal field extent of 2 mm that lies within the biological range.
Conclusion: The axonal anatomy mediates a tradeoff between encoding multiple place field sizes or achieving a high spatial information score, and the combination of both properties is necessary to maximize spatial encoding by a network.
Significance: In total, this paper establishes a mechanistic neuronal network model that, in concert with information-theoretic and statistical methods, can be used to investigate how lower level properties contribute to higher level function.
Figures
Similar articles
-
Decoding Position to Analyze Spatial Information Encoding in a Large-Scale Neuronal Network Model of Rat Dentate Gyrus.Annu Int Conf IEEE Eng Med Biol Soc. 2018 Jul;2018:6137-6140. doi: 10.1109/EMBC.2018.8513576. Annu Int Conf IEEE Eng Med Biol Soc. 2018. PMID: 30441735 Free PMC article.
-
A million-plus neuron model of the hippocampal dentate gyrus: Dependency of spatio-temporal network dynamics on topography.Annu Int Conf IEEE Eng Med Biol Soc. 2015;2015:4713-6. doi: 10.1109/EMBC.2015.7319446. Annu Int Conf IEEE Eng Med Biol Soc. 2015. PMID: 26737346 Free PMC article.
-
A Million-Plus Neuron Model of the Hippocampal Dentate Gyrus: Critical Role for Topography in Determining Spatiotemporal Network Dynamics.IEEE Trans Biomed Eng. 2016 Jan;63(1):199-209. doi: 10.1109/TBME.2015.2445771. Epub 2015 Jun 16. IEEE Trans Biomed Eng. 2016. PMID: 26087482 Free PMC article.
-
Function of local circuits in the hippocampal dentate gyrus-CA3 system.Neurosci Res. 2019 Mar;140:43-52. doi: 10.1016/j.neures.2018.11.003. Epub 2018 Nov 5. Neurosci Res. 2019. PMID: 30408501 Review.
-
Structural reorganization of the dentate gyrus following entorhinal denervation: species differences between rat and mouse.Prog Brain Res. 2007;163:501-28. doi: 10.1016/S0079-6123(07)63027-1. Prog Brain Res. 2007. PMID: 17765735 Review.
Cited by
-
Generation of Granule Cell Dendritic Morphologies by Estimating the Spatial Heterogeneity of Dendritic Branching.Front Comput Neurosci. 2020 Apr 9;14:23. doi: 10.3389/fncom.2020.00023. eCollection 2020. Front Comput Neurosci. 2020. PMID: 32327990 Free PMC article.
-
Network Activity Due to Topographic Organization of Schaffer Collaterals in a Large-Scale Model of Rat CA1.Annu Int Conf IEEE Eng Med Biol Soc. 2019 Jul;2019:2977-2980. doi: 10.1109/EMBC.2019.8856799. Annu Int Conf IEEE Eng Med Biol Soc. 2019. PMID: 31946514 Free PMC article.
-
ReBaCCA-ss: Relevance-Balanced Continuum Correlation Analysis with Smoothing and Surrogating for Quantifying Similarity Between Population Spiking Activities.ArXiv [Preprint]. 2025 May 19:arXiv:2505.13748v1. ArXiv. 2025. PMID: 40470475 Free PMC article. Preprint.
-
Topographic Organization of Correlation Along the Longitudinal and Transverse Axes in Rat Hippocampal CA3 Due to Excitatory Afferents.Front Comput Neurosci. 2020 Nov 20;14:588881. doi: 10.3389/fncom.2020.588881. eCollection 2020. Front Comput Neurosci. 2020. PMID: 33328947 Free PMC article.
-
Bridging Hierarchies in Multi-Scale Models of Neural Systems: Look-Up Tables Enable Computationally Efficient Simulations of Non-linear Synaptic Dynamics.Front Comput Neurosci. 2021 Oct 1;15:733155. doi: 10.3389/fncom.2021.733155. eCollection 2021. Front Comput Neurosci. 2021. PMID: 34658827 Free PMC article.
References
-
- Squire LR, “Memory and the hippocampus: A synthesis from findings with rats, monkeys, and humans.,” Psychological Review, vol. 99, no. 2. American Psychological Association, US, pp. 195231, 1992. - PubMed
-
- Ambros-Ingerson J, Granger R, and Lynch G, “Simulation of paleocortex performs hierarchical clustering,” Science (80-.)., vol. 247, no. 4948, p. 1344 LP–1348, Mar. 1990. - PubMed
