Multicenter Study
. 2019 Jan 24;16(1):e1002730.
doi: 10.1371/journal.pmed.1002730. eCollection 2019 Jan.

Predicting survival from colorectal cancer histology slides using deep learning: A retrospective multicenter study

Affiliations
Multicenter Study

Predicting survival from colorectal cancer histology slides using deep learning: A retrospective multicenter study

Jakob Nikolas Kather et al. PLoS Med. .

Abstract

Background: For virtually every patient with colorectal cancer (CRC), hematoxylin-eosin (HE)-stained tissue slides are available. These images contain quantitative information, which is not routinely used to objectively extract prognostic biomarkers. In the present study, we investigated whether deep convolutional neural networks (CNNs) can extract prognosticators directly from these widely available images.

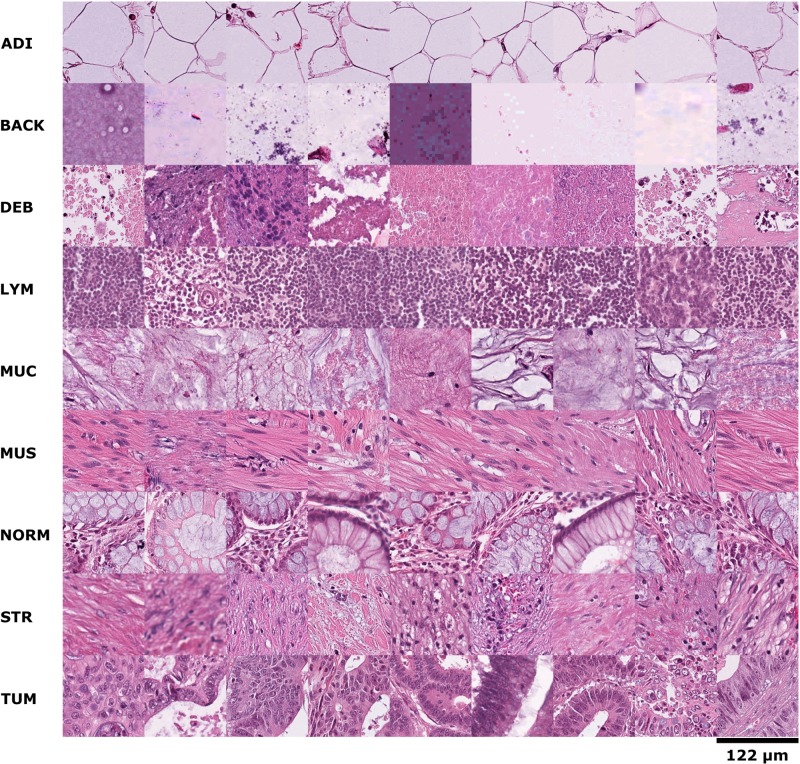
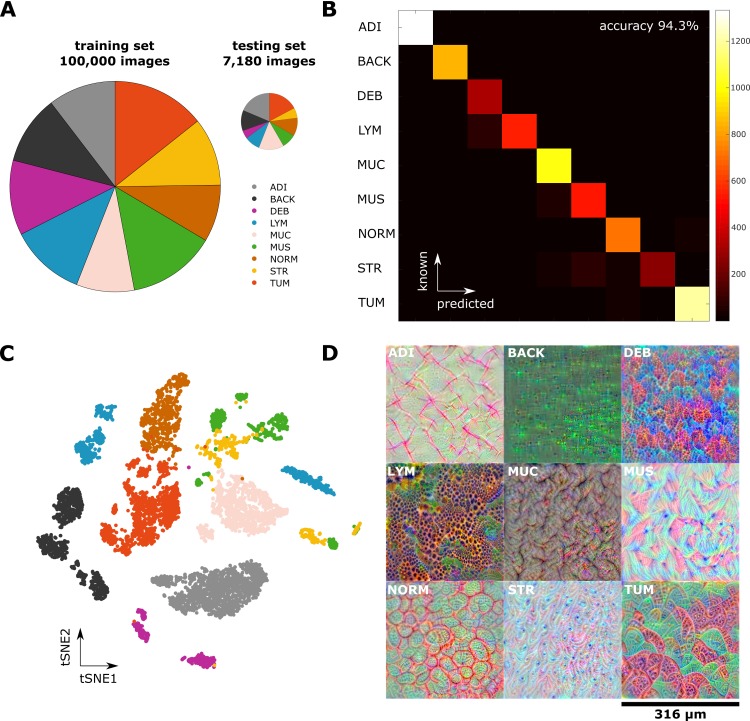
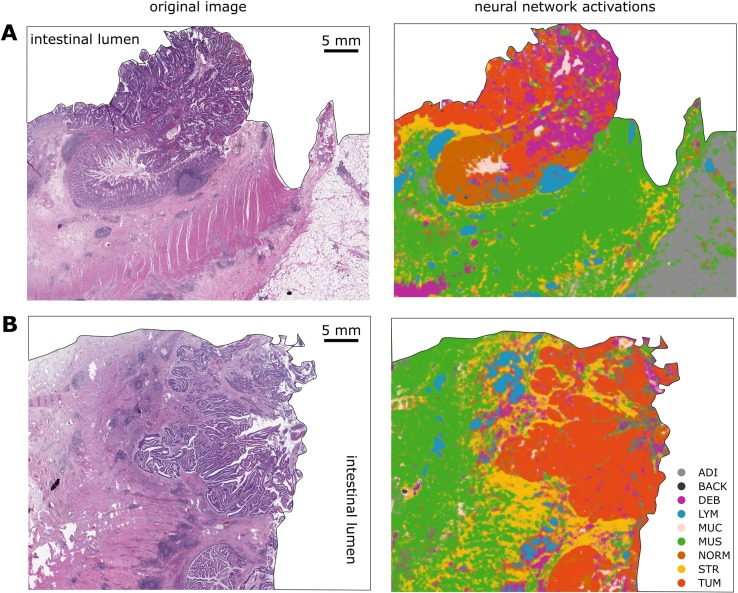
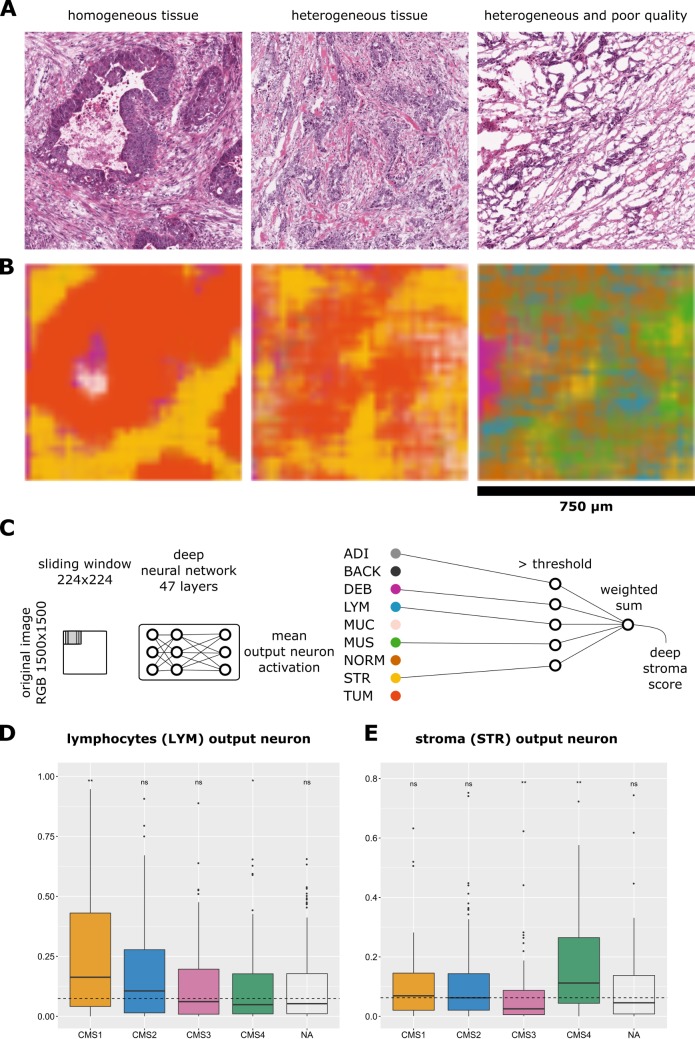
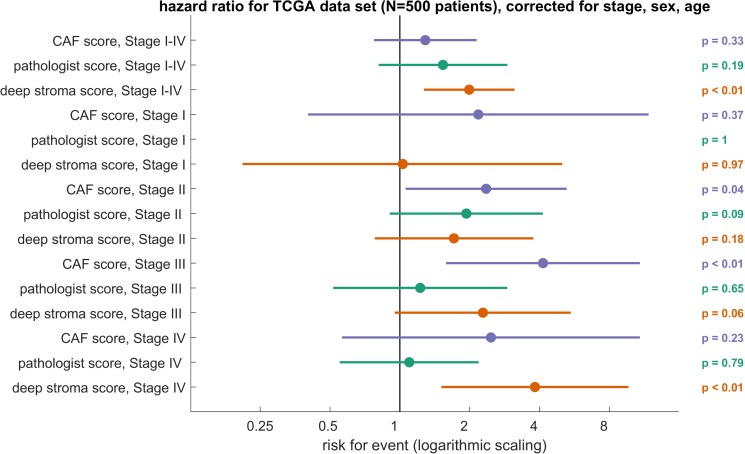
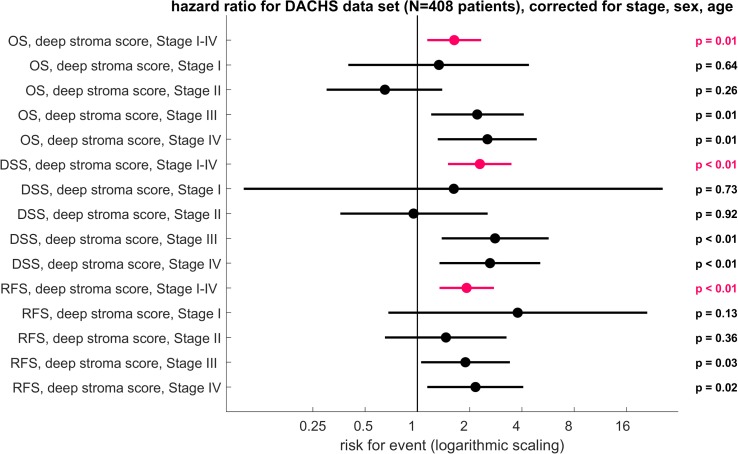
Methods and findings: We hand-delineated single-tissue regions in 86 CRC tissue slides, yielding more than 100,000 HE image patches, and used these to train a CNN by transfer learning, reaching a nine-class accuracy of >94% in an independent data set of 7,180 images from 25 CRC patients. With this tool, we performed automated tissue decomposition of representative multitissue HE images from 862 HE slides in 500 stage I-IV CRC patients in the The Cancer Genome Atlas (TCGA) cohort, a large international multicenter collection of CRC tissue. Based on the output neuron activations in the CNN, we calculated a "deep stroma score," which was an independent prognostic factor for overall survival (OS) in a multivariable Cox proportional hazard model (hazard ratio [HR] with 95% confidence interval [CI]: 1.99 [1.27-3.12], p = 0.0028), while in the same cohort, manual quantification of stromal areas and a gene expression signature of cancer-associated fibroblasts (CAFs) were only prognostic in specific tumor stages. We validated these findings in an independent cohort of 409 stage I-IV CRC patients from the "Darmkrebs: Chancen der Verhütung durch Screening" (DACHS) study who were recruited between 2003 and 2007 in multiple institutions in Germany. Again, the score was an independent prognostic factor for OS (HR 1.63 [1.14-2.33], p = 0.008), CRC-specific OS (HR 2.29 [1.5-3.48], p = 0.0004), and relapse-free survival (RFS; HR 1.92 [1.34-2.76], p = 0.0004). A prospective validation is required before this biomarker can be implemented in clinical workflows.

Conclusions: In our retrospective study, we show that a CNN can assess the human tumor microenvironment and predict prognosis directly from histopathological images.


Conflict of interest statement

The authors have declared that no competing interests exist.

Figures

Fig 1
Fig 1. Example images for each of the nine tissue classes represented in the NCT-CRC-HE-100K data set.
ADI, adipose tissue; BACK, background; CRC, colorectal cancer; DEB, debris; HE, hematoxylin–eosin; LYM, lymphocytes; MUC, mucus; MUS, smooth muscle; NCT, National Center for Tumor Diseases; NORM, normal colon mucosa; STR, cancer-associated stroma; TUM, colorectal adenocarcinoma epithelium.
Fig 2
Fig 2. A CNN learns robust representations of histological images and attains high classification accuracy.
(A) A nine-class training set containing 100,000 unique images and a testing set of 7,180 unique images. Classes are adipose, background, debris, lymphocytes, mucus, smooth muscle, normal mucosa, stroma, cancer epithelium. Pie area is proportional to sample number. (B) Confusion matrix of the CNN-based classification; overall accuracy is 94%. (C) tSNE of the testing set based on deep layer activations of the trained CNN. Tissue classes naturally aggregate in separate clusters, with close proximity of the TUM and NORM cluster and the MUS and STR cluster, respectively. (D) Deep dream visualization of the spatial patterns represented in the trained CNN. For all tissue classes, the network has learned to visually discern key features. For example, LYM are composed of tightly collected small round cells, and NORM is composed of glands in an even distribution pattern. ADI, adipose tissue; BACK, background; CNN, convolutional neural network; DEB, debris; LYM, lymphocytes; MUC, mucus; MUS, smooth muscle; NORM, normal mucosa; STR, stroma; tSNE, t-distributed stochastic neighbor embedding; TUM, cancer epithelium.
Fig 3
Fig 3. A CNN can segment histopathological whole-slide images.
The neural network classifier was used to classify real-world images from the DACHS cohort. (A) and (B) show two representative example images. Left: original HE image; right: classification map. Even fine structures are recognized by the neural network even in regions of suboptimal tissue quality. Only the tissue is shown in this example, and because the tissue does not occupy a rectangular area on the pathology slide, the whole-slide image was manually segmented by an observer trained in pathology to show only tissue without background for better clarity (background is white). ADI, adipose tissue; BACK, background; CNN, convolutional neural network; DACHS, Darmkrebs: Chancen der Verhütung durch Screening; DEB, debris; HE, hematoxylin–eosin; LYM, lymphocyte aggregates; MUC, mucus; MUS, muscle; NORM, normal mucosa; STR, stroma; TUM, tumor epithelium.
Fig 4
Fig 4. Prognostication of CRC outcome by a deep stroma score.
(A) HE images in the TCGA cohort had heterogeneous texture, and some had poor quality. Image size is 1,500 × 1,500 px, and regions were classified with a sliding window of 224 × 224 px. (B) Neural network activations corresponding to the images shown in panel A are visualized. Even in the poor-quality case, tissue structures are recognized by the network. (C) A deep stroma score based on neural network activations is defined as the weighted sum of stromal tissue classes that are above threshold. (D, E) Mean output layer activation for lymphocytes and stroma separated by CMS. Activation of (D) lymphocytes and (E) stroma were assessed in images from 425 patients from the TCGA cohort. As expected, CMS1 highly activated the lymphocyte output neuron, while CMS4 highly activates the stroma output neuron. *p ≤ 0.05, **p ≤ 0.01; ns > 0.05; two-tailed t test for each group versus all samples. The dashed line marks the mean of all samples against which t test was performed. The line within each box marks the median of that group, the full box contains all samples between the 25th and the 75th percentile, and the vertical lines extend to the smallest and largest nonoutlier value (R ggplot2 geom_boxplot convention). CMS, consensus molecular subtype; CRC, colorectal cancer; HE, hematoxylin–eosin; LYM, lymphocytes; NA, not available; ns, not significant; px, pixels; STR, stroma; TCGA, The Cancer Genome Atlas.
Fig 5
Fig 5. Deep stroma score is an independent prognosticator for shorter OS in the TCGA cohort.
HRs with 95% CI in multivariable Cox models including cancer stage (I–IV), sex, and age for a CAF gene expression score, pathologist’s manual quantification of stromal percentage as provided in the TCGA metadata and the deep stroma score. The deep stroma score was binarized into high/low at the median. The other scores (CAF, pathologist) were binarized at an optimal threshold (optimal Youden index). Only the deep stroma score was significantly associated with prognosis in the whole cohort (stage I–IV). The horizontal axis is scaled logarithmically (log 10). CAF, cancer-associated fibroblast; CI, confidence interval; HR, hazard ratio; OS, overall survival; TCGA, The Cancer Genome Atlas.
Fig 6
Fig 6. Deep stroma score applied to the validation data set (DACHS cohort).
HRs with 95% CI in multivariable Cox models including cancer stage (I–IV), sex, and age for the deep stroma score. HR for OS, DSS, and RFS are plotted. The deep stroma score was stratified into high/low at the median of the training set. In this validation cohort, the deep stroma score was an independent prognostic factor over all stages and within stage III and stage IV tumors. The horizontal axis is scaled logarithmically (log 10). CI, confidence interval; DACHS, Darmkrebs: Chancen der Verhütung durch Screening; DSS, disease-specific survival; HR, hazard ratio; OS, overall survival; RFS, relapse-free survival.

Comment in

References

    1. Waldman AD, Jackson A, Price SJ, Clark CA, Booth TC, Auer DP, et al. Quantitative imaging biomarkers in neuro-oncology. Nature Reviews Clinical Oncology. 2009;6:445–54. 10.1038/nrclinonc.2009.92 - DOI - PubMed
    1. O'Connor JP, Jackson A, Asselin M-C, Buckley DL, Parker GJ, Jayson GC. Quantitative imaging biomarkers in the clinical development of targeted therapeutics: current and future perspectives. The Lancet Oncology. 2008;9:766–76. 10.1016/S1470-2045(08)70196-7 - DOI - PubMed
    1. Spratlin JL, Serkova NJ, Eckhardt SG. Clinical Applications of Metabolomics in Oncology: A Review. Clinical Cancer Research. 2009;15:431–40. 10.1158/1078-0432.CCR-08-1059 - DOI - PMC - PubMed
    1. Kurland BF, Gerstner ER, Mountz JM, Schwartz LH, Ryan CW, Graham MM, et al. Promise and pitfalls of quantitative imaging in oncology clinical trials. Magnetic Resonance Imaging. 2012;30:1301–12. 10.1016/j.mri.2012.06.009 - DOI - PMC - PubMed
    1. Gurcan MN, Boucheron LE, Can A, Madabhushi A, Rajpoot NM, Yener B. Histopathological image analysis: a review. IEEE Rev Biomed Eng. 2009;2:147–71. Epub 2009/01/01. 10.1109/RBME.2009.2034865 - DOI - PMC - PubMed

Publication types

LinkOut - more resources