

Bacterial regulation of macrophage bacterial recognition receptors in COPD are differentially modified by budesonide and fluticasone propionate
- PMID: 30677037
- PMCID: PMC6345465
- DOI: 10.1371/journal.pone.0207675
Bacterial regulation of macrophage bacterial recognition receptors in COPD are differentially modified by budesonide and fluticasone propionate
Abstract
Rationale: Patients with COPD have an increased risk for community-acquired pneumonia, which is further increased by inhaled corticosteroids.
Objective: To assess effects of the corticosteroids, budesonide and fluticasone propionate, on macrophage bacterial responses in COPD.
Methods: Monocyte-derived macrophages (MDMs) generated from blood monocytes from 10 non-smoker controls (NoS), 20 smokers without COPD (Sm), and 40 subjects with moderate to severe COPD (21 ex-smokers (COPD-ES) and 19 current smokers (COPD-S)) were pre-treated with budesonide or fluticasone (10 nM-1 μM) and challenged with live non-typeable Haemophilus influenzae (NTHI) or Streptococcus pneumoniae (SP). Cell surface bacterial recognition receptor expression (flow cytometry) and cytokine release (bead array) were analyzed.
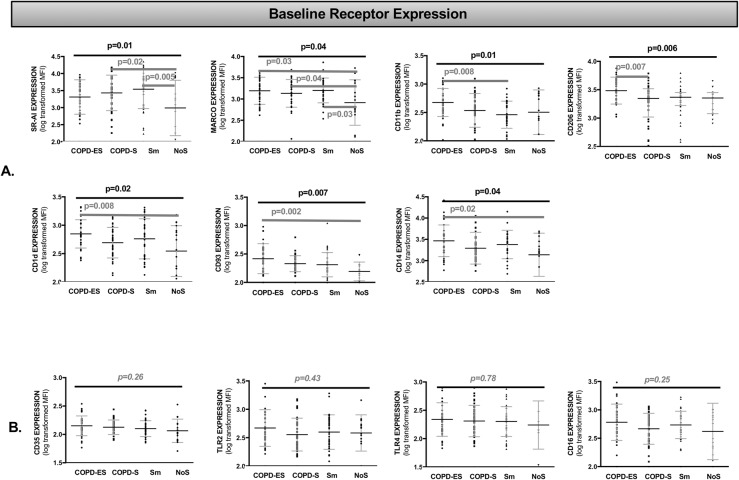
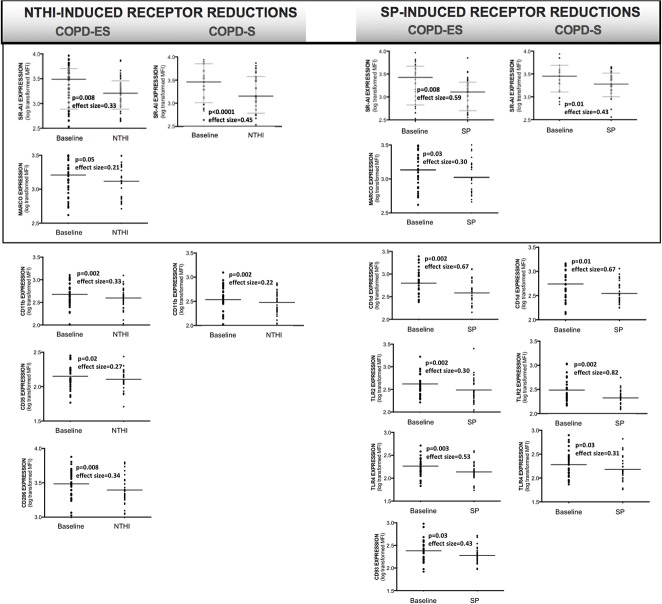
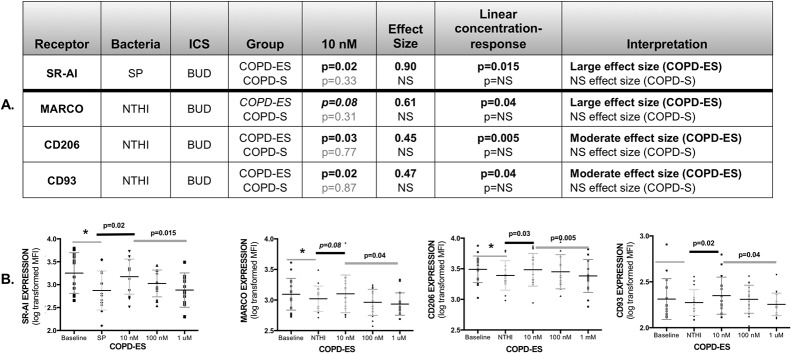
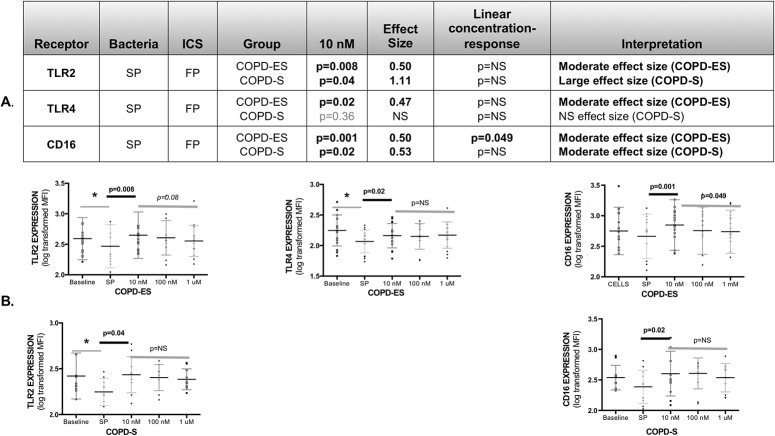
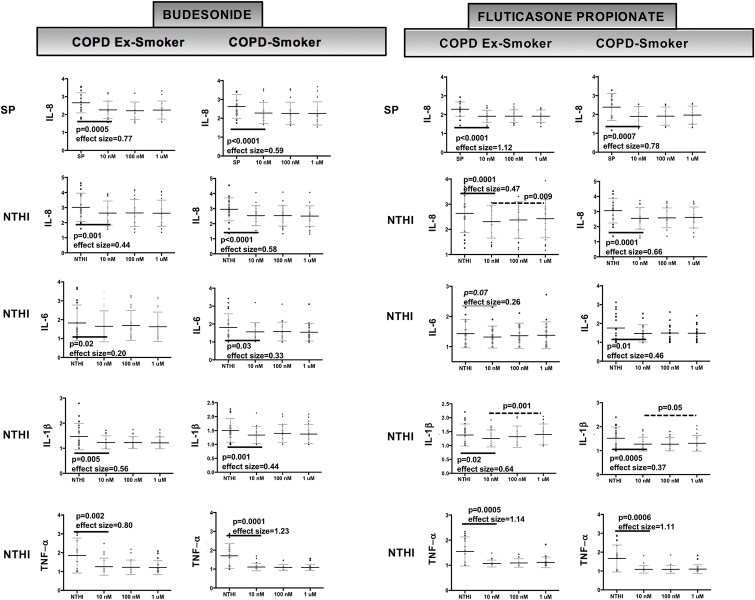
Results: NTHI and SP reduced bacterial recognition receptor expression on MDMs from COPD and Sm, but not NoS (except TLR4). SR-AI and MARCO were reduced by both NTHI and SP, whereas other receptors by either NTHI or SP. Among COPD subjects, COPD-ES demonstrated a greater number of reductions as compared to COPD-S. NTHI reduced SR-AI, MARCO, CD11b, CD35 and CD206 in COPD-ES while only SR-AI and CD11b in COPD-S. SP reduced SRA-1, CD1d, TLR2 and TLR4 in both COPD-ES and COPD-S, and reduced MARCO and CD93 only in COPD-ES. All receptors reduced in COPD by NTHI and most by SP, were also reduced in Sm. Budesonide counteracted the receptor reductions induced by both NTHI (CD206 p = 0.03, MARCO p = 0.08) and SP (SR-AI p = 0.02) in COPD-ES. Fluticasone counteracted only SP-induced reductions in TLR2 (p = 0.008 COPD-ES and p = 0.04 COPD-S) and TLR4 (p = 0.02 COPD-ES). Cytokine release was equivalently reduced by both corticosteroids.
Conclusions: Reduction in macrophage bacterial recognition receptors during bacterial exposure could provide a mechanism for the increased pneumonia risk in COPD. Differential effects of budesonide and fluticasone propionate on macrophage bacterial recognition receptor expression may contribute to the higher pneumonia incidence reported with fluticasone propionate.
Conflict of interest statement
Author Karin Provost received research grant funding from: 1. Pulmatrix, LLC that immediately preceded the work 2. Pfizer, ASPIRE Awards in Adult Vaccine Research that followed the data collection and overlapped with analysis 3. Clinical Advisory Board, ARSANIS, starting 2017. Author Sanjay Sethi received research grant funding from: 1. AstraZeneca for a separate project on the presence and role of biofilms that overlapped the time frame of the research. 2. National Center for Advancing Translational Science (National Institutes of Health (NIH), CTSA Award) 3. National Institute of Allergy and Infectious Disease (NIAID) (NIH) (co-PI) 4. National Heart, Lung, Blood Institute (NHLBI) Subcontract (NIH). Author Anna Miller-Laarson was a full-time employee at AstraZeneca AB. Author Miyuki Smith, the lab technician, received salary support from the grant funding of AstraZeneca AB, provided by the Buffalo Institute of Medical Research. AstraZeneca AB was allowed, by the VA-approved research CRADA, to review the data and provide comments, but were not allowed to influence the data presented or withhold any parts from publication. There are no patents, products in development or marketed products associated with this research to declare. This does not alter our adherence to PLOS ONE policies on sharing data and materials.
Figures
Similar articles
-
Comparison of fluticasone propionate and budesonide on COPD macrophage and neutrophil function.Int J Chron Obstruct Pulmon Dis. 2018 Sep 17;13:2883-2897. doi: 10.2147/COPD.S169337. eCollection 2018. Int J Chron Obstruct Pulmon Dis. 2018. PMID: 30271135 Free PMC article.
-
Calcium restores the macrophage response to nontypeable haemophilus influenzae in chronic obstructive pulmonary disease.Am J Respir Cell Mol Biol. 2015 Jun;52(6):728-37. doi: 10.1165/rcmb.2014-0172OC. Am J Respir Cell Mol Biol. 2015. PMID: 25338285
-
Steroid-induced Deficiency of Mucosal-associated Invariant T Cells in the Chronic Obstructive Pulmonary Disease Lung. Implications for Nontypeable Haemophilus influenzae Infection.Am J Respir Crit Care Med. 2016 Nov 15;194(10):1208-1218. doi: 10.1164/rccm.201601-0002OC. Am J Respir Crit Care Med. 2016. PMID: 27115408 Free PMC article.
-
Scientific rationale for the possible inhaled corticosteroid intraclass difference in the risk of pneumonia in COPD.Int J Chron Obstruct Pulmon Dis. 2017 Oct 19;12:3055-3064. doi: 10.2147/COPD.S143656. eCollection 2017. Int J Chron Obstruct Pulmon Dis. 2017. PMID: 29089754 Free PMC article. Review.
-
Differences in the efficacy and safety among inhaled corticosteroids (ICS)/long-acting beta2-agonists (LABA) combinations in the treatment of chronic obstructive pulmonary disease (COPD): Role of ICS.Pulm Pharmacol Ther. 2015 Feb;30:44-50. doi: 10.1016/j.pupt.2014.10.006. Epub 2014 Nov 6. Pulm Pharmacol Ther. 2015. PMID: 25445928 Review.
Cited by
-
Conserved anti-inflammatory effects and sensing of butyrate in zebrafish.Gut Microbes. 2020 Nov 9;12(1):1-11. doi: 10.1080/19490976.2020.1824563. Gut Microbes. 2020. PMID: 33064972 Free PMC article.
-
Beclomethasone Has Lesser Suppressive Effects on Inflammation and Antibacterial Immunity Than Fluticasone or Budesonide in Experimental Infection Models.Chest. 2020 Sep;158(3):947-951. doi: 10.1016/j.chest.2020.05.531. Epub 2020 May 23. Chest. 2020. PMID: 32454043 Free PMC article. No abstract available.
-
Benefit:Risk Profile of Budesonide in Obstructive Airways Disease.Drugs. 2019 Nov;79(16):1757-1775. doi: 10.1007/s40265-019-01198-7. Drugs. 2019. PMID: 31549299 Free PMC article. Review.
-
How inhaled corticosteroids target inflammation in COPD.Eur Respir Rev. 2023 Oct 18;32(170):230084. doi: 10.1183/16000617.0084-2023. Print 2023 Dec 31. Eur Respir Rev. 2023. PMID: 37852657 Free PMC article. Review.
-
Mangiferin Inhibits Apoptosis and Autophagy Induced by Staphylococcus aureus in RAW264.7 Cells.J Inflamm Res. 2020 Nov 3;13:847-857. doi: 10.2147/JIR.S280091. eCollection 2020. J Inflamm Res. 2020. PMID: 33177860 Free PMC article.
References
-
- Almirall J, Bolibar I, Balanzo X, Gonzalez CA. Risk factors for community-acquired pneumonia in adults: a population-based case-control study. Eur Respir J. 1999;13(2):349–55. . - PubMed
-
- Almirall J, Gonzalez CA, Balanzo X, Bolibar I. Proportion of community-acquired pneumonia cases attributable to tobacco smoking. Chest. 1999;116(2):375–9. . - PubMed
Publication types
MeSH terms
Substances
LinkOut - more resources
Full Text Sources
Medical
Research Materials
Miscellaneous
