. 2019 Jan 24;14(1):e0210949.
doi: 10.1371/journal.pone.0210949. eCollection 2019.

Enhanced activity of pyramidal neurons in the infralimbic cortex drives anxiety behavior

Affiliations

Enhanced activity of pyramidal neurons in the infralimbic cortex drives anxiety behavior

Laura Berg et al. PLoS One. .

Abstract

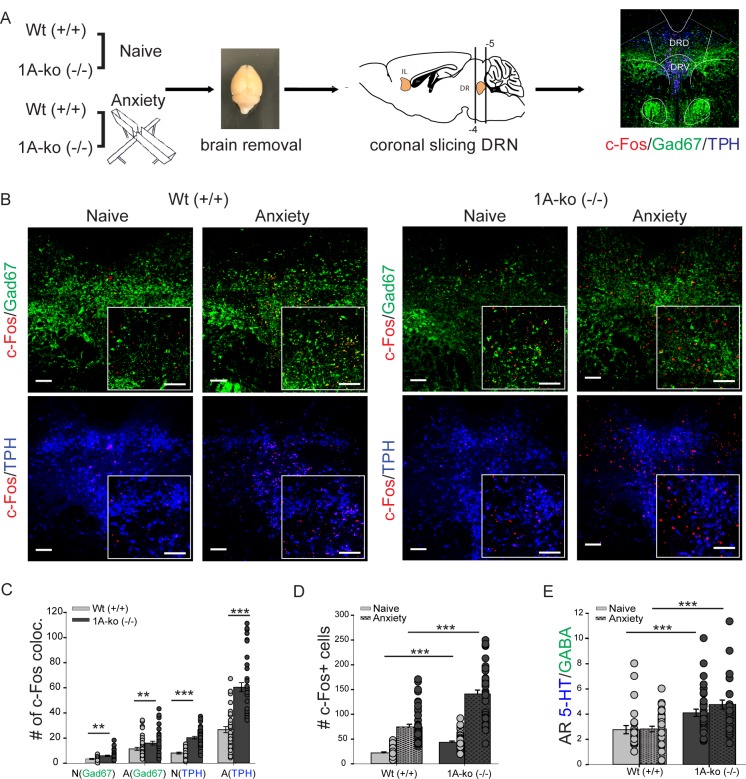
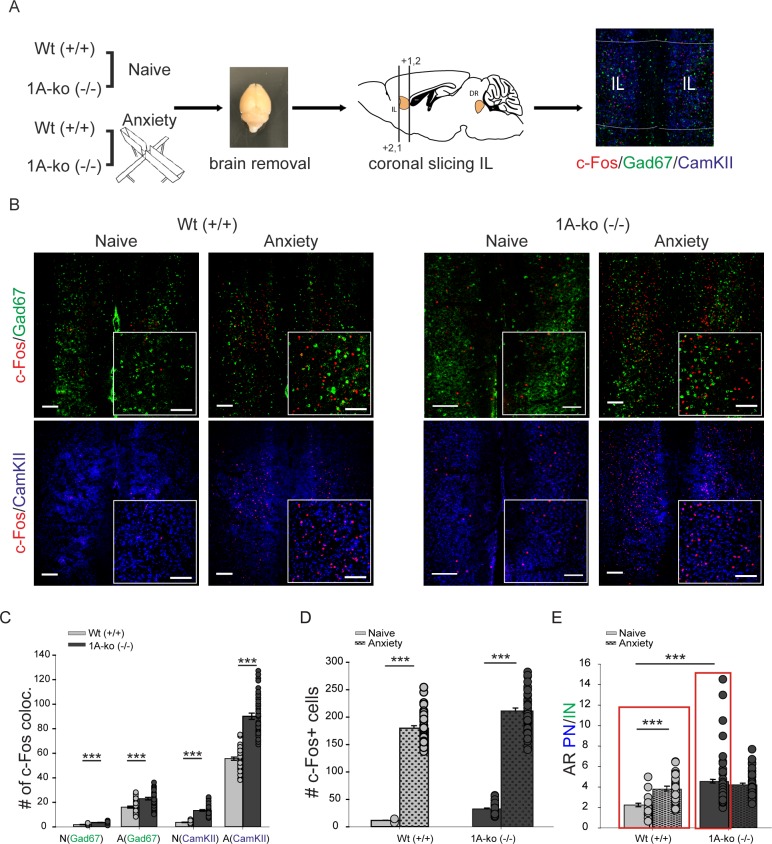
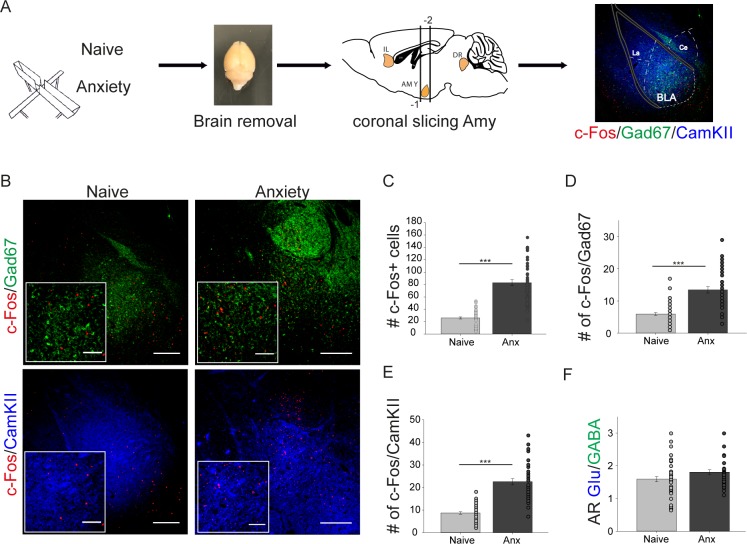
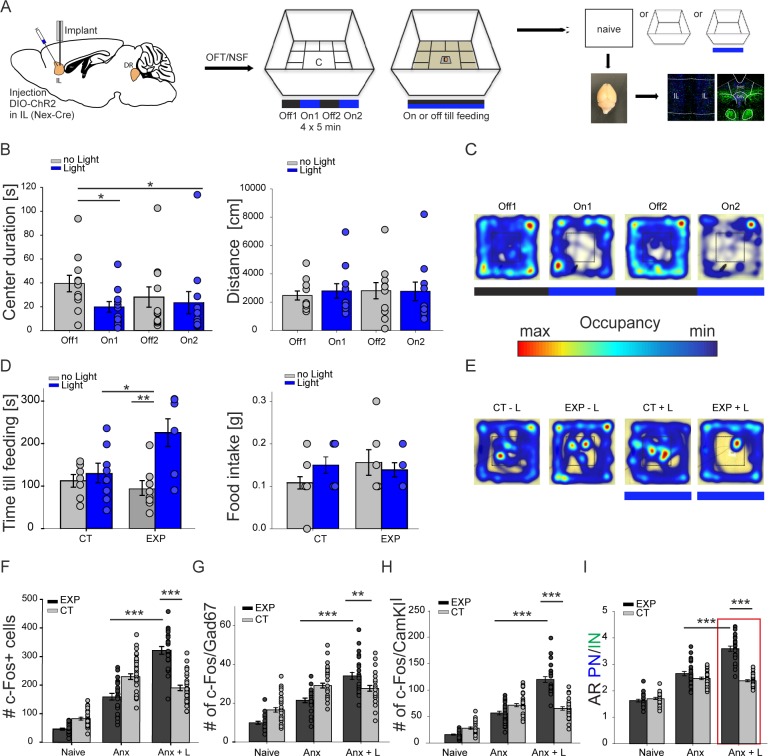
We show that in an animal model of anxiety the overall excitation, particularly in the infralimbic region of the medial prefrontal cortex (IL), is increased and that the activity ratio between excitatory pyramidal neurons and inhibitory interneurons (AR PN/IN) is shifted towards excitation. The same change in AR PN/IN is evident for wildtype mice, which have been exposed to an anxiety stimulus. We hypothesize, that an elevated activity and the imbalance of excitation (PN) and inhibition (IN) within the neuronal microcircuitry of the prefrontal cortex is responsible for anxiety behaviour and employed optogenetic methods in freely moving mice to verify our findings. Consistent with our hypothesis elevation of pyramidal neuron activity in the infralimbic region of the prefrontal cortex significantly enhanced anxiety levels in several behavioural tasks by shifting the AR PN/IN to excitation, without affecting motor behaviour, thus revealing a novel mechanism by which anxiety is facilitated.


Conflict of interest statement

The authors have declared that no competing interests exist.

Figures

Fig 1
Fig 1. AR 5-HT/GABA in the serotonergic system is not changed due to anxiety.
(A) experimental workflow of c-fos stainings. DRN dorsal raphe nucleus, c-fos marked in red, Gad67 fluorescence labeling of GABAergic neurons (green), TPH fluorescence labeling of serotonergic neurons (red). (B) confocal images showing c-fos expression in wildtype (Wt) and 5-HT1A(-/-) knockout mice (1A-ko). C-fos in red. Insets show high magnification. Scale bar 150μm, insets 100 μm. (C) colocalization of c-fos expression in GABAergic and serotonergic cells (analysis of 42 brain slices from 3 brains per group). N naive, A anxiety. N(Gad67) Wt 3.34±0.37, 1A-ko 5.88±0.53, Mann Whitney Rank Sum test, p = 0.003, A(Gad67) Wt 11.4±1.25, 1A-ko 15.98±1.52, Mann Whitney Rank Sum, p = 0.01, N(TPH) Wt 8.19±0.81, 1A-ko 20.29±1, two tailed t-test t = -8.595, p≤0.001, A(TPH) Wt 26.69±2.38 1A-ko 60.48±3.58, Mann Whitney Rank Sum test, p≤0.001. (D) total amount of c-fos expressing cells. Wt naïve 22.14±2.06, 1A-ko naïve 43.43±2.47, two-tailed t-test t = -5.978, p≤0.001, Wt anxiety 74.47±5.48, 1A-ko anxiety 141.14±7.8 Mann Whitney Rank Sum test p≤0.001 (E) activity ratio between serotonergic neurons and interneurons (AR 5-HT/GABA) calculated as ratio between c-fos positive serotonergic and c-fos positive GABAergic neurons. Wt naïve 2.77±0.33, Wt anxiety 2.79±0.19, Mann Whitney Rank Sum test, p = 0.372, 1A-ko naïve 4.11±0.27, 1A-ko anxiety 4.76±0.36, Mann Whitney Rank Sum test, p = 0.238. Values are mean ± S.E.M. ** indicate significant differences (p≤ 0.01), ***indicate significant differences (p≤ 0.001).
Fig 2
Fig 2. Elevation of cortical excitation during anxiety behavior.
(A) experimental workflow of c-fos stainings. IL infralimbic cortex, Gad67 fluorescence labeling of GABAergic neurons (green), CamKII fluorescence labeling of pyramidal neurons (blue). (B) confocal images showing c-fos expression in Wt and 1A-ko. C-fos in red. Insets show high magnification. Scale bar 150μm, insets 100μm. (C) colocalization of c-fos expression in GABAergic and pyramidal cells (analysis of 42 brain slices in 3 brains per group). N(GAD67) Wt 1.82±0.13, 1A-ko 3.52±0.2, Mann Whitney Rank Sum test, p≤0.001, A(GAD67) Wt 16.1±0.84, 1A-ko 23.92±1.07, Mann Whitney Rank Sum test, p≤0.001, N(CamKII) Wt 3.68±0.2, 1A-ko 13.4±0.61, Mann Whitney Rank Sum test, p≤0.001, A(CamKII) Wt 55.64±1.29, 1A-ko 90.19±2.55, Mann Whitney Rank Sum test, p≤0.001. (D) total amount of c-fos expressing cells. Wt naïve 11.64±0.45, 1A-ko naïve 32.74±1.45, Mann Whitney Rank Sum test, p≤0.001, Wt anxiety 179.9±4.6, 1A-ko anxiety 211.33±5.36, Mann Whitney Rank Sum test, p≤0.001. (E) activity ratio between pyramidal neurons and interneurons (AR PN/IN), calculated as ratio between c-fos positive pyramidal and c-fos positive GABAergic neurons. Wt naïve 2.24±0.17, Wt anxiety 3.8±0.18, Mann Whitney Rank Sum p≤0.001, 1A-ko naïve 4.53±0.42,1A-ko anxiety 4.2±0.18 Mann Whitney Rank Sum p = 0.291, Wt naïve:1A-ko naïve, Mann Whitney Rank Sum test p≤0.001. Values are mean ± S.E.M. *** indicate significant differences (p≤ 0.001). Red boxes show significant difference between Wt and 1A-ko.
Fig 3
Fig 3. AR Glu/GABA in the basolateral amygdala is not changed due to anxiety.
(A) experimental workflow of c-fos stainings in the amygdala. AMY amygdala, BLA basolaterale amygdala, Ce central amygdala, DR dorsal raphe, IL infralimbic cortex, La lateral amygdala. Gad67 fluorescence labeling of GABAergic neurons (green), CamKII fluorescence labeling of pyramidal neurons (blue), c-fos fluorescence labeling of c-fos expressing cells (red). (B) confocal images showing c-fos expression in the amygdala of naïve and anxiety treated mice. Gad67 fluorescence labeling of GABAergic neurons (green), CamKII fluorescence labeling of pyramidal neurons (blue), c-fos fluorescence labeling of c-fos expressing cells (red). Scale bar 250μm, Insets high magnification, scale bar 100μm. (C) total amount of c-fos expressing cells (analysis of 56 brain slices in 4 brains for naïve conditions and 42 brain slices in 3 brains for the anxiety condition): naïve 26.07±1.69, Anx 82.9±4.87, Mann Whitney Rank Sum test p≤0.001. (D) colocalization of c-fos expression in GABAergic cells: Naïve 5.95±0.44, Anx 13.45±0.98, Mann Whitney Rank Sum test p≤0.001. (E) colocalization of c-fos expression in pyramidal cells: naïve 8.72±0.55, Anx 22.57±1.34, Mann Whitney Rank Sum test p≤0.001. (F) activity ratio between glutamatergic neurons and interneurons (AR Glu/GABA), calculated as ratio between c-fos positive pyramidal and c-fos positive GABAergic neurons: naïve 1.59±0.08, Anx 1.81±0.07, Mann Whitney Rank Sum test, p = 0.075 n.s. Values are mean ± SEM. *** indicate significant differences (p≤0.001).
Fig 4
Fig 4. Elevated cortical AR PN/IN balance drives anxiety behavior.
(A) targeting ChR2 to pyramidal cortical neurons and experimental workflow. IL infralimbic cortex (B) group data for openfield experiments in ChR2 injected animals (EXP), center duration Off1 39.49±6.9s, On1 19.87±4.47s, Off2 28.13±8.55s, On2 23.42±9.32s, Off1:On1 two tailed t-test, t = 2.286, p = 0.033, Off1:Off2 Mann Whitney Rank Sum test p = 0.168, Off1:On2 Mann Whitney Rank Sum test p = 0.049, distance moved Off1 2703.09±292.65cm, On1 3113.4±491.15cm, Off2 3331.86±482.62cm, On2 3082.17±658,61cm, Off1:On1 Mann Whitney Rank Sum test p = 0.743, Off1:Off2 two tailed t-test t = 0.52, p = 0.609, Off1:On2 Mann Whitney Rank Sum p = 0.646, n = 11 mice. (C) example of raw data from an individual mouse during an openfield test. (D) group data for novelty suppressed feeding, time till feeding CT no light 112.42±14.9s, CT light 129.38±22.96s, EXP no light 93.38±17.41s, EXP light 225.86±32.76s, CT light:EXP light, two tailed t-test, t = -2.461, p = 0.029, EXP no light:EXP light Mann Whitney Rank Sum test p = 0.004, food intake CT no light 0.12±0.02g, CT light 0.15±0.02g, EXP no light 0.16±0.03, EXP light 0.15±0.02 CT light:EXP light Mann Whitney Rank Sum test, p = 1, EXP no light:EXP light Mann Whitney Rank Sum test p = 0.955. (E) example of raw data from an individual mouse during novelty suppressed feeding test. (F) total amount of c-fos expressing cells, naïve EXP 47.11±3.25, CT 83.86±5, Anx EXP 160.14±10.14, CT 231.21±9.93, Anx+L EXP 323.38±13.61, CT 192.11±9.51. Anx EXP:Anx+L EXP two tailed-t-test t = -9.709, p≤0.001, Anx+L EXP:Anx+L CT two tailed-t-test t = -8, p≤0.001. Anx anxiety paradigm, Anx+L anxiety paradigm with light stimulation (G) colocalization of c-fos expression in GABAergic neurons (Gad67) naïve EXP 9.93±0.76, CT 16.57±1.17, Anx EXP 21.5±1.2, CT 29.14±1.23, Anx+L EXP 34.12±1.84, CT 27.71±1.49. Anx EXP:Anx+L EXP Mann Whitney Rank Sum test, p≤0.001, Anx+L EXP:Anx+L CT two tailed-t-test t = -2.714, p = 0.009. (H) colocalization of c-fos expression in pyramidal neurons (CamKII) naïve EXP 16.04±1.14, CT 28.21±2.1, Anx EXP 56.68±3.52, CT 71.57±2.98, Anx+L EXP 120.08±542, CT 65.46±3.26. Anx EXP:Anx+L EXP Mann Whitney Rank Sum test, p≤0.001, Anx+L EXP:Anx+L CT Mann Whitney Rank Sum test p≤0.001. (I) activity ratio between pyramidal neurons and interneurons (AR PN/IN), calculated as ratio between c-fos positive pyramidal and c-fos positive GABAergic neurons. Naïve EXP 1.63±0.05, CT 1.7±0.04, Anx EXP 2.65±0.08, CT 2.47±0.05, Anx+L EXP 3.59±0.1 CT 2.38±0.04. Anx EXP: Anx+L EXP two tailed t-test t = -7.377, p≤0.001, Anx+L EXP: Anx+L CT Mann Whitney Rank Sum test p≤0.001.Values are mean ± S.E.M. * indicate significant differences (p≤ 0.05), ** indicate significant differences (p≤ 0.01), *** indicate significant differences (p≤ 0.001).

Similar articles

Cited by

References

    1. Gross C, Hen R. The developmental origins of anxiety. Nat Rev Neurosci. 2004;5: 545–552. 10.1038/nrn1429 - DOI - PubMed
    1. Kessler RC, Berglund P, Demler O, Jin R, Merikangas KR, Walters EE. Lifetime Prevalence and Age-of-Onset Distributions of DSM-IV Disorders in the National Comorbidity Survey Replication. Arch Gen Psychiatry. American Medical Association; 2005;62: 593–602. 10.1001/archpsyc.62.6.593 - DOI - PubMed
    1. Yizhar O, Fenno LE, Prigge M, Schneider F, Davidson TJ, O'Shea DJ, et al. Neocortical excitation/inhibition balance in information processing and social dysfunction. Nature. 2011;477: 171–178. 10.1038/nature10360 - DOI - PMC - PubMed
    1. Shah AA, Sjovold T, Treit D. Inactivation of the medial prefrontal cortex with the GABAA receptor agonist muscimol increases open-arm activity in the elevated plus-maze and attenuates shock-probe burying in rats. Brain Res. 2004;1028: 112–115. 10.1016/j.brainres.2004.08.061 - DOI - PubMed
    1. Jinks AL, McGregor IS. Modulation of anxiety-related behaviours following lesions of the prelimbic or infralimbic cortex in the rat. Brain Res. 1997;772: 181–190. - PubMed

Publication types

MeSH terms