. 2019 Apr;23(4):2384-2398.
doi: 10.1111/jcmm.14043. Epub 2019 Jan 24.

O-GlcNAc transferase activates stem-like cell potential in hepatocarcinoma through O-GlcNAcylation of eukaryotic initiation factor 4E

Affiliations

O-GlcNAc transferase activates stem-like cell potential in hepatocarcinoma through O-GlcNAcylation of eukaryotic initiation factor 4E

Benjin Cao et al. J Cell Mol Med. 2019 Apr.

Abstract

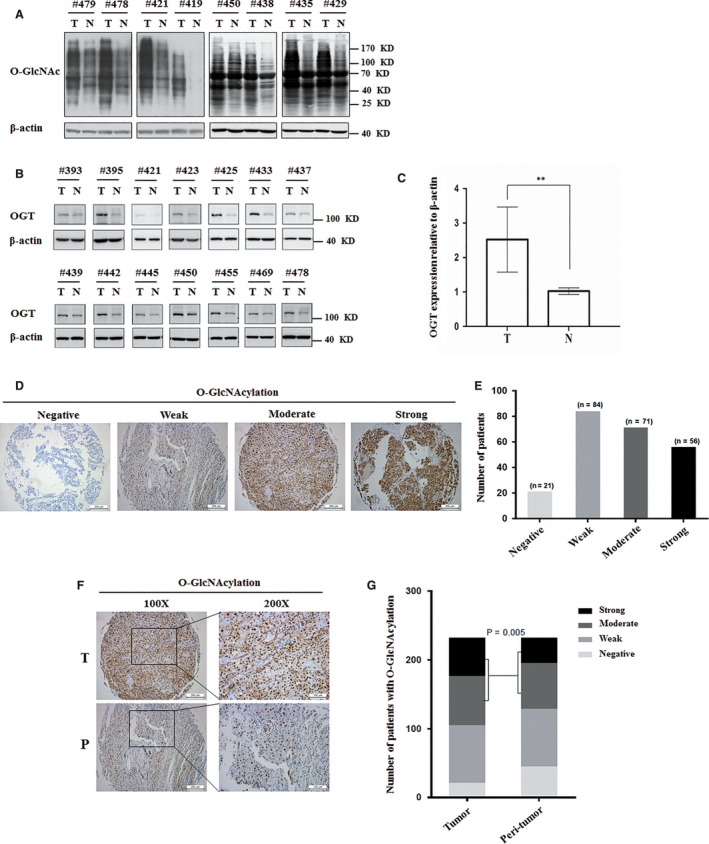
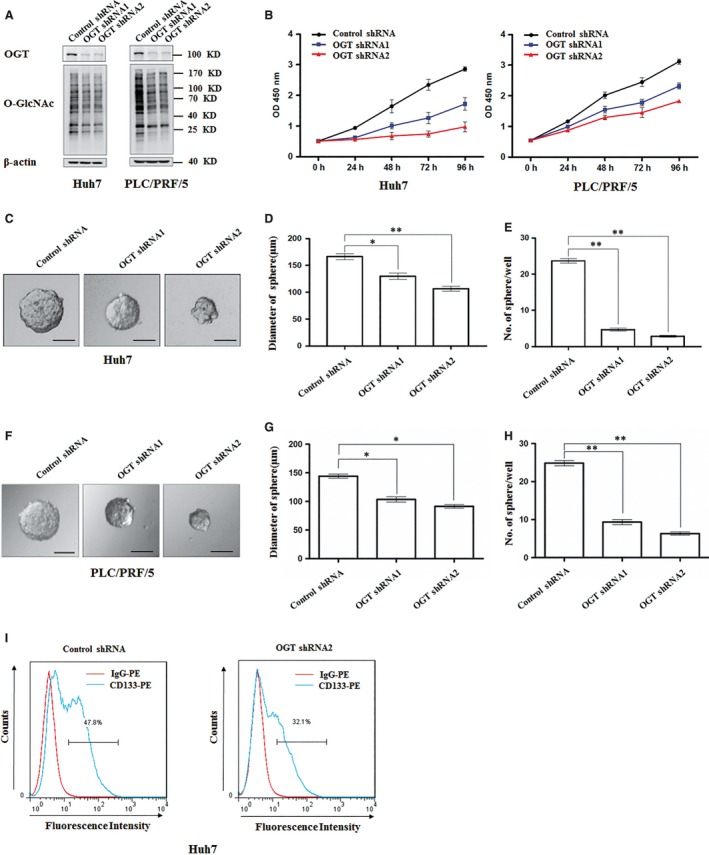
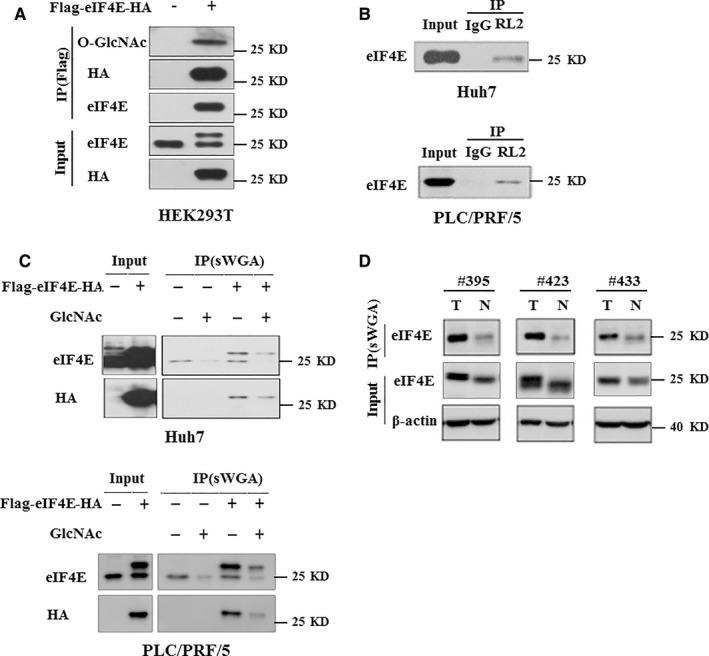
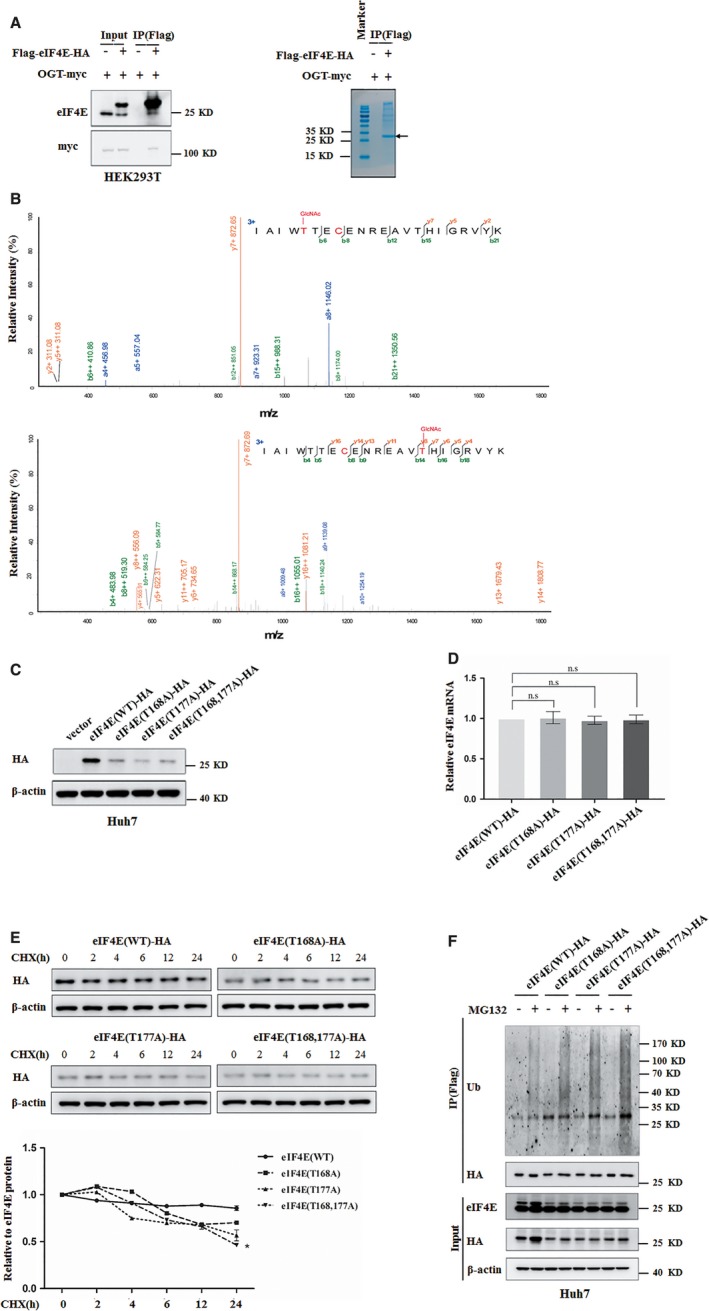
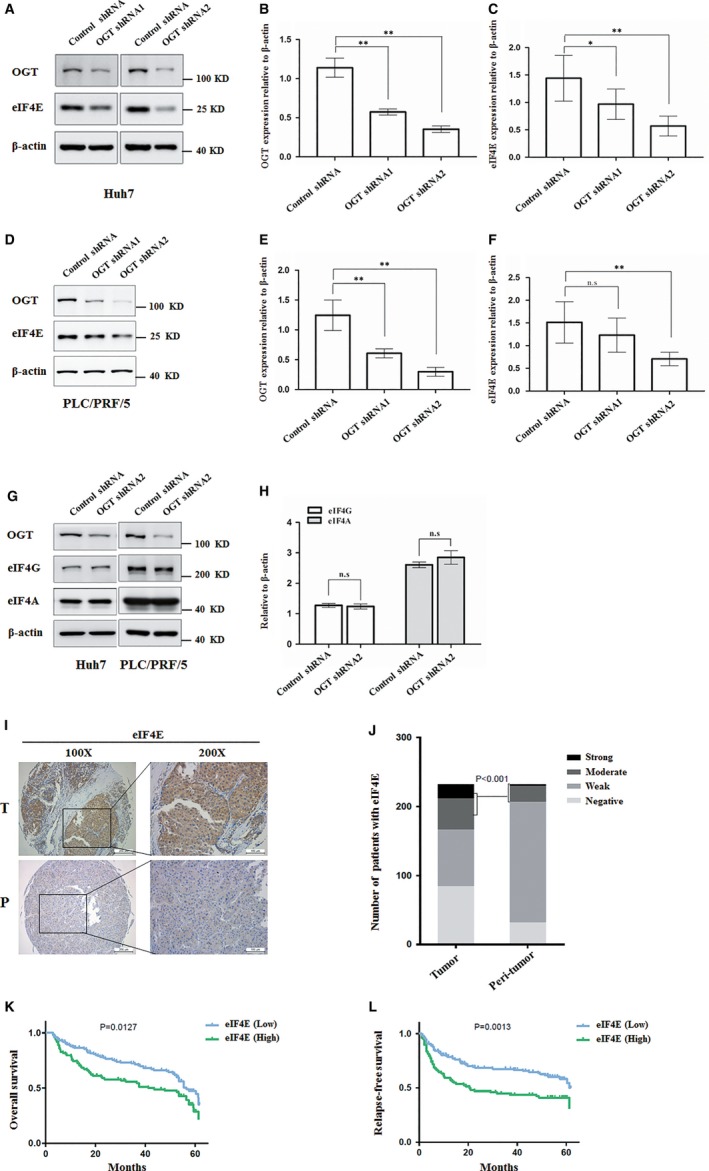
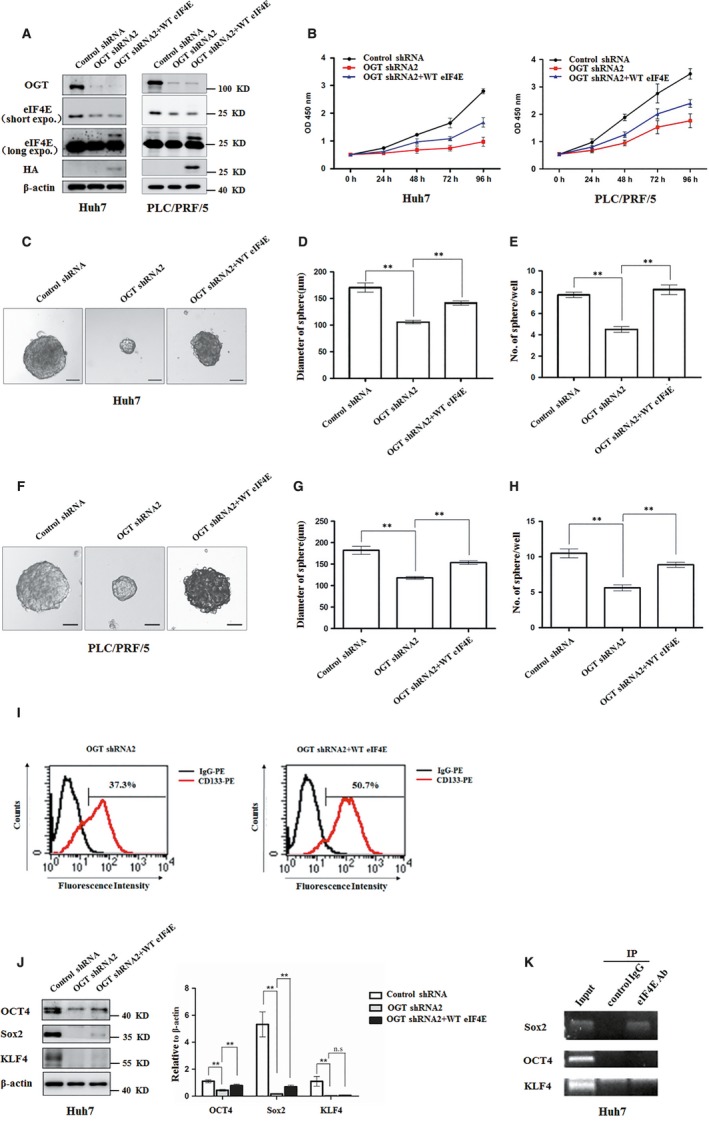
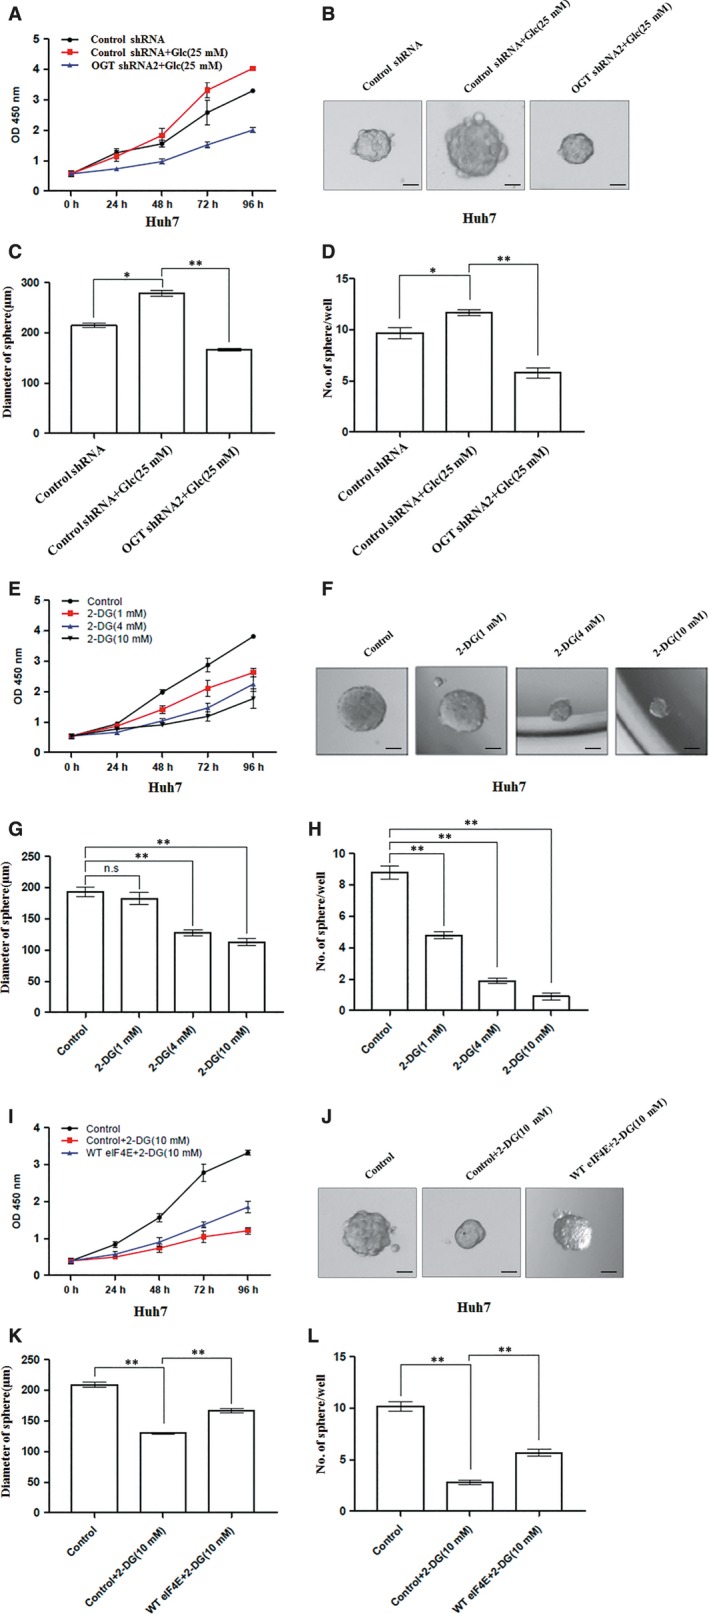
O-GlcNAcylation catalysed by O-GlcNAc transferase (OGT) is a reversible post-translational modification. O-GlcNAcylation participates in transcription, epigenetic regulation, and intracellular signalling. Dysregulation of O-GlcNAcylation in response to high glucose or OGT expression has been implicated in metabolic diseases and cancer. However, the underlying mechanisms by which OGT regulates hepatoma development remain largely unknown. Here, we employed the lentiviral shRNA-based system to knockdown OGT to analyse the contribution of OGT in hepatoma cell proliferation and stem-like cell potential. The sphere-forming assay and western blot analysis of stem-related gene expression were used to evaluate stem-like cell potential of hepatoma cell. We found that the level of total O-GlcNAcylation or OGT protein was increased in hepatocellular carcinoma. OGT activated stem-like cell potential in hepatoma through eukaryotic initiation factor 4E (eIF4E) which bound to stem-related gene Sox2 5'-untranslated region. O-GlcNAcylation of eIF4E at threonine 168 and threonine 177 protected it from degradation through proteasome pathway. Expression of eIF4E in hepatoma was determined by immunostaining in 232 HCC patients, and Kaplan-Meier survival analysis was used to determine the correlation of eIF4E expression with prognosis. High glucose promoted stem-like cell potential of hepatoma cell through OGT-eIF4E axis. Collectively, our findings indicate that OGT promotes the stem-like cell potential of hepatoma cell through O-GlcNAcylation of eIF4E. These results provide a mechanism of HCC development and a cue between the pathogenesis of HCC and high glucose condition.

Keywords: O-GlcNAc transferase; O-GlcNAcylation; eukaryotic initiation factor 4E; hepatocellular carcinoma; stem-like cell potential.


Conflict of interest statement

The authors declare that they have no conflicts of interest with the contents of this article.

Figures

Figure 1
Figure 1
The difference of O‐GlcNAcylation and OGT protein level between hepatoma tissues and adjacent normal liver tissues. A, The level of total O‐GlcNAcylation was analysed in eight paired HCC specimens with their corresponding non‐cancerous specimens by western blotting. β‐actin expression was served as a loading control. B, OGT protein expression levels were analysed in 14 paired HCC specimens by western blotting. β‐actin expression was served as a loading control. C, OGT values were calculated from images in B. Data represent mean ± SD of at least three independent experiments. **P < 0.01. D, Representative immunohistochemical staining of O‐GlcNAcylation in liver cancer tissues. E, Number of different staining of O‐GlcNAcylation patients was analysed. F, Representative immunohistochemical staining of O‐GlcNAcylation in liver cancer tissues and peri‐tumour liver tissues. G, Quantitative analysis of the level of O‐GlcNAcylation in liver cancer tissue microarrays showed that the expression of O‐GlcNAcylation was increased in liver cancer (P = 0.005). Immunohistochemical staining was estimated, as follows: negative: staining intensity ≤10%; weak: staining intensity in 10%‐20%; moderate: staining intensity in 20%‐50%; strong: staining intensity > 50%. T: tumour sample; N: non‐cancerous sample
Figure 2
Figure 2
Knockdown of OGT inhibits the proliferation and tumorsphere formation of hepatoma cell in vitro. A, Huh7 and PLC/PRF/5 cells were infected with control shRNA, OGT shRNA1, and OGT shRNA2 lentivirus. Protein lysates were collected after 48 h for immunoblot analysis with indicated antibodies. β‐actin expression was served as a loading control. B, Cell proliferation of Huh7 and PLC/PRF/5 cells infected with control shRNA, OGT shRNA1, and OGT shRNA2 lentivirus were measured with CCK8 assay. (C‐H) Huh7 and PLC/PRF/5 cells, respectively, infected with the indicated lentivirus were seeded into 96‐well plates. After 12 d, tumorsphere were counted and quantified. Representative images of sphere (scale bars, 100 μm) were shown (C, F). The diameter of sphere (D, G) and number of sphere (E, H) were count. Data represent mean ± SD of at least three independent experiments. *P < 0.05; **P < 0.01. I, Huh7 cells expressing either control shRNA or OGT shRNA2 were incubated with PE‐labelled anti‐AC133 antibody. The percentages of CD133+ cells in graphs were analysed by flow cytometry. Red line, control IgG staining; blue line, CD133 staining. Representative flow cytometry data from three independent experiments were shown
Figure 3
Figure 3
eIF4E is modified with O‐GlcNAc in vivo and in vitro. A, Exogenous Flag‐eIF4E‐HA was O‐GlcNAcylated in HEK293T cells. B, Endogenous eIF4E was O‐GlcNAcylated in Huh7 and PLC/PRF/5 cells. O‐GlcNAc modified protein obtained from cell extracts were analysed by immunoblotting for eIF4E. C, Exogenous eIF4E was O‐GlcNAcylated in Huh7 and PLC/PRF/5 cells using another method. Total O‐GlcNAc‐modified proteins were precipitated with succinylated wheat germ agglutinin (sWGA), a lectin binding specifically to O‐GlcNAc. The precipitates were then analysed by western blotting for eIF4E. For control, monosaccharide inhibitor GlcNAc (N‐Acetyl‐D‐glucosamine, 50 mM) was added during sWGA lectin‐affinity purification. The specificity of the sWGA lectin is illustrated by effectively competing the lectin with GlcNAc. D, Paired HCC specimens lysates were subjected to sWGA‐affinity purification and the precipitates were analysed by western blotting for eIF4E. β‐actin expression was served as a loading control
Figure 4
Figure 4
eIF4E is O‐GlcNAc‐modified at Threonine 168 and Threonine 177. A, Flag‐eIF4E was purified from HEK293T cells co‐expressing with OGT by immunoprecipitated for western blotting (left panel) and coomassie blue staining (right panel). The arrow indicated Flag‐tagged eIF4E. B, Flag‐eIF4E was analysed by mass spectrometry. Mass spectrum of the doubly charged peptide IAIWT (GlcNAc T) ECENREAV (GlcNAc T) HIGRVYK showed O‐GlcNAcylation at Thr168 and Thr177. The b and y type product ions were marked on the spectrum. C, The level of eIF4E protein in Huh7 cells transfected with plasmids expressing wild‐type eIF4E or its O‐GlcNAcylation site mutant were analysed by western blotting. β‐actin expression was served as a loading control. D, The levels of exogenous eIF4E mRNA in Huh7 cells transfected with plasmids expressing wild‐type eIF4E or its O‐GlcNAcylation site mutant were analysed by quantitative reverse transcription PCR and normalized against β‐actin. Error bars represent ±SD of triplicate experiments. The two‐tailed Student's t test was used. n.s, no significance. E, Huh7 cells were transfected with plasmids expressing wild‐type eIF4E or its O‐GlcNAcylation site mutant before CHX (10 μg/mL) was added and treated for indicated durations. Levels of exogenous eIF4E were determined by western blotting and normalized against β‐actin. The bottom panel showcases relative protein amounts of different groups. Error bars represent ±SD of triplicate experiments. *P < 0.05. F, Huh7 cells transfected with plasmids expressing wild‐type eIF4E or its O‐GlcNAcylation site mutant were treated with MG132 (5 μg/mL) for 24 h. Exogenous eIF4E expression was examined using western blot analysis (bottom panel). β‐actin expression was served as a loading control. Exogenous eIF4E immunoprecipitated from Huh7 cells with anti‐FLAG M2 affinity gel were further examined with ubiquitination antibody (top panel)
Figure 5
Figure 5
OGT knockdown reduces eIF4E protein expression and higher expression of eIF4E indicates a poor prognosis in HCC patients. A, The protein level of eIF4E was analysed by western blotting in Huh7 infected with control shRNA, OGT shRNA1 and OGT shRNA2 lentivirus. β‐actin expression was served as a loading control. B, OGT values were calculated from images in A. Data represent mean ± SD of at least three independent experiments. **P < 0.01. C, eIF4E values were calculated from images in A. Data represent mean ± SD of at least three independent experiments. *P < 0.05; **P < 0.01. D, The protein level of eIF4E was analysed by western blotting in PLC/PRF/5 cells infected with control shRNA, OGT shRNA1, and OGT shRNA2 lentivirus. β‐actin expression was served as a loading control. E, OGT values were calculated from images in D. Data represent mean ± SD of at least three independent experiments. **P < 0.01. F, eIF4E values were calculated from images in D. Data represent mean ± SD of at least three independent experiments. **P < 0.01; n.s, no significance. G, The protein level of eIF4A and eIF4G were analysed by western blotting in Huh7 and PLC/PRF/5 cells infected with control shRNA or OGT shRNA2 lentivirus. β‐actin expression was served as a loading control. H, eIF4G, and eIF4A values were calculated from images in G. Data represent mean ± SD of at least three independent experiments. n.s, no significance. I, Representative immunohistochemical staining of eIF4E in liver cancer tissues and peri‐tumour liver tissues. J, Quantitative analysis of liver cancer tissue microarrays showed that the expression of eIF4E was higher in liver cancer tissues than in normal liver tissues (P < 0.001). K, Kaplan‐Meier overall survival (OS) curve of HCC patients in correlation with expression of eIF4E. L, Kaplan‐Meier disease‐free survival (DFS) curve of HCC patients in correlation with expression of eIF4E. The DFS and OS rate significantly decreased in high expression of eIF4E (green line) compared to low expression of eIF4E (blue line)
Figure 6
Figure 6
Knockdown OGT inhibits proliferation and tumorsphere formation of hepatoma cell through reducing eIF4E expression. A, Huh7 and PLC/PRF/5 cells were infected with control shRNA, OGT shRNA2 alone, or with wild‐type eIF4E lentivirus. The cell lysates were harvested for western blotting analysis using indicated antibodies. β‐actin expression was served as a loading control. B, Cell proliferation of Huh7 and PLC/PRF/5 cells infected with lentiviruses as in panel (A) were measured with CCK8 assay. (C‐H) Huh7 and PLC/PRF/5 cells infected with lentiviruses as in panel (A) were seeded into 96‐well plates. After 12 d, tumorsphere were counted and quantified. Representative images of sphere (scale bars, 100 μm) were shown (C, F). The diameter of sphere (D, G) and number of sphere (E, H) were count. Data represent mean ± SD of at least three independent experiments. The two‐tailed Student's t tests were used. **P < 0.01. I, Huh7 cells expressing either OGT shRNA2 alone or with wild‐type eIF4E lentivirus were incubated with PE‐labelled anti‐AC133 antibody. The percentages of CD133+ cells in graphs were analysed by flow cytometry. Black line, control IgG staining; red line, CD133 staining. J, Cell lysates were examined by western blotting with indicated antibodies. The right panel showcases relative protein amounts of different groups. Error bars represent ±SD of triplicate experiments. **P < 0.01; n.s, no significance. K, Huh7 cells were collected and subjected to immunoprecipitation with antibody against eIF4E or normal mouse IgG. Total RNAs were purified from immunocomplexes and subjected to RT‐PCR to measure Sox2, OCT4, and KLF4 mRNAs associated with eIF4E
Figure 7
Figure 7
Glucose regulates cell proliferation and tumorsphere formation of hepatoma cell through OGT. A, Cell proliferation of Huh7 cells infected with control shRNA, OGT shRNA2 lentivirus and then treated with or without glucose (25 mM) were measured with CCK8 assay. (B‐D) Huh7 cells as in panel (A) in conditional culture treated with or without glucose (25 mM) were seeded into 96‐well plates. After 12 d, tumorsphere were counted and quantified. Representative images of sphere (scale bars, 100 μm) were shown (B). The diameter of sphere (C) and number of sphere (D) were count. (E) Cell proliferation of Huh7 cells treated with different concentrations of 2‐DG were measured with CCK8 assay. (F‐H) Huh7 cells treated with different concentrations of 2‐DG were seeded into 96‐well plates. After 12 d, tumorsphere were counted and quantified. Representative images of sphere (scale bars, 100 μm) were shown (F). The diameter of sphere (G) and number of sphere (H) were count. I, Cell proliferation of Huh7 cells infected with control, WT eIF4E lentivirus and then treated with or without 2‐DG (10 mM) were measured with CCK8 assay. (J‐L) Huh7 cells as in panel (I) were seeded into 96‐well plates in conditional culture treated with or without 2‐DG (10 mM). After 12 d, tumorsphere were counted and quantified. Representative images of sphere (scale bars, 100 μm) were shown (J). The diameter of sphere (K) and the number of sphere (L) were count. Data are quantified and presented as three independent experiments. The two‐tailed Student's t tests were used. *P < 0.05; **P < 0.01; n.s, no significance

References

    1. Kew MC. Hepatocellular carcinoma in developing countries: Prevention, diagnosis and treatment. World J Hepatol. 2012;4:99. - PMC - PubMed
    1. Strosnider H, Azziz‐Baumgartner E, Banziger M, et al. Workgroup report: public health strategies for reducing aflatoxin exposure in developing countries. Environ Health Perspect. 2006;114:1898‐1903. - PMC - PubMed
    1. Wild CP, Hall AJ. Primary prevention of hepatocellular carcinoma in developing countries. Mutat Res. 2000;462:381‐393. - PubMed
    1. Fasani P, Sangiovanni A, De Fazio C, et al. High prevalence of multinodular hepatocellular carcinoma in patients with cirrhosis attributable to multiple risk factors. Hepatology. 1999;29:1704‐1707. - PubMed
    1. Lai S‐W, Chen P‐C, Liao K‐F, et al. Risk of hepatocellular carcinoma in diabetic patients and risk reduction associated with anti‐diabetic therapy: a population‐based cohort study. Am J Gastroenterol. 2011;107:46‐52. - PubMed

Publication types

MeSH terms