Phases of Metabolic and Soft Tissue Changes in Months Preceding a Diagnosis of Pancreatic Ductal Adenocarcinoma
- PMID: 30677401
- PMCID: PMC6475474
- DOI: 10.1053/j.gastro.2019.01.039
Phases of Metabolic and Soft Tissue Changes in Months Preceding a Diagnosis of Pancreatic Ductal Adenocarcinoma
Abstract
Background & aims: Identifying metabolic abnormalities that occur before pancreatic ductal adenocarcinoma (PDAC) diagnosis could increase chances for early detection. We collected data on changes in metabolic parameters (glucose, serum lipids, triglycerides; total, low-density, and high-density cholesterol; and total body weight) and soft tissues (abdominal subcutaneous fat [SAT], adipose tissue, visceral adipose tissue [VAT], and muscle) from patients 5 years before the received a diagnosis of PDAC.
Methods: We collected data from 219 patients with a diagnosis of PDAC (patients) and 657 healthy individuals (controls) from the Rochester Epidemiology Project, from 2000 through 2015. We compared metabolic profiles of patients with those of age- and sex-matched controls, constructing temporal profiles of fasting blood glucose, serum lipids including triglycerides, cholesterol profiles, and body weight and temperature for 60 months before the diagnosis of PDAC (index date). To construct the temporal profile of soft tissue changes, we collected computed tomography scans from 68 patients, comparing baseline (>18 months before diagnosis) areas of SAT, VAT, and muscle at L2/L3 vertebra with those of later scans until time of diagnosis. SAT and VAT, isolated from healthy individuals, were exposed to exosomes isolated from PDAC cell lines and analyzed by RNA sequencing. SAT was collected from KRAS+/LSLG12D P53flox/flox mice with PDACs, C57/BL6 (control) mice, and 5 patients and analyzed by histology and immunohistochemistry.
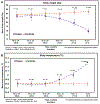
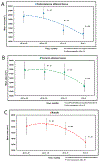
Results: There were no significant differences in metabolic or soft tissue features of patients vs controls until 30 months before PDAC diagnosis. In the 30 to 18 months before PDAC diagnosis (phase 1, hyperglycemia), a significant proportion of patients developed hyperglycemia, compared with controls, without soft tissue changes. In the 18 to 6 months before PDAC diagnosis (phase 2, pre-cachexia), patients had significant increases in hyperglycemia and decreases in serum lipids, body weight, and SAT, with preserved VAT and muscle. In the 6 to 0 months before PDAC diagnosis (phase 3, cachexia), a significant proportion of patients had hyperglycemia compared with controls, and patients had significant reductions in all serum lipids, SAT, VAT, and muscle. We believe the patients had browning of SAT, based on increases in body temperature, starting 18 months before PDAC diagnosis. We observed expression of uncoupling protein 1 (UCP1) in SAT exposed to PDAC exosomes, SAT from mice with PDACs, and SAT from all 5 patients but only 1 of 4 controls.
Conclusions: We identified 3 phases of metabolic and soft tissue changes that precede a diagnosis of PDAC. Loss of SAT starts 18 months before PDAC identification, and is likely due to browning. Overexpression of UCP1 in SAT might be a biomarker of early-stage PDAC, but further studies are needed.
Keywords: Asymptomatic; Carcinogenesis; Diabetes; Disease Progression.
Copyright © 2019 AGA Institute. Published by Elsevier Inc. All rights reserved.
Conflict of interest statement
Figures


Comment in
-
Metabolic Alterations as a Signpost to Early Pancreatic Cancer.Gastroenterology. 2019 May;156(6):1560-1563. doi: 10.1053/j.gastro.2019.03.028. Epub 2019 Mar 26. Gastroenterology. 2019. PMID: 30926350 No abstract available.
References
-
- Krauss RM. Lipids and lipoproteins in patients with type 2 diabetes. Diabetes Care 2004;27:1496–504. - PubMed
Publication types
MeSH terms
Substances
Grants and funding
LinkOut - more resources
Full Text Sources
Medical
Research Materials
Miscellaneous

