Is the most representative skunk the average or the stinkiest? Developmental changes in representations of biological categories
- PMID: 30677631
- PMCID: PMC6487486
- DOI: 10.1016/j.cogpsych.2018.12.004
Is the most representative skunk the average or the stinkiest? Developmental changes in representations of biological categories
Abstract
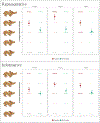
People often think of categories in terms of their most representative examples (e.g., robin for BIRD). Thus, determining which exemplars are most representative is a fundamental cognitive process that shapes how people use concepts to navigate the world. The present studies (N = 669; ages 5 years - adulthood) revealed developmental change in this important component of cognition. Studies 1-2 found that young children view exemplars with extreme values of characteristic features (e.g., the very fastest cheetah) as most representative of familiar biological categories; the tendency to view average exemplars in this manner (e.g., the average-speeded cheetah) emerged slowly across age. Study 3 examined the mechanisms underlying these judgments, and found that participants of all ages viewed extreme exemplars as representative of novel animal categories when they learned that the variable features fulfilled category-specific adaptive needs, but not otherwise. Implications for developmental changes in conceptual structure and biological reasoning are discussed.
Keywords: Biological reasoning; Conceptual development; Ideals.
Copyright © 2019 Elsevier Inc. All rights reserved.
Figures


Similar articles
-
Categories convey prescriptive information across domains and development.J Exp Child Psychol. 2021 Dec;212:105231. doi: 10.1016/j.jecp.2021.105231. Epub 2021 Aug 3. J Exp Child Psychol. 2021. PMID: 34358722 Free PMC article.
-
Continuity and change in the development of category-based induction: The test case of diversity-based reasoning.Cogn Psychol. 2015 Nov;82:74-95. doi: 10.1016/j.cogpsych.2015.07.003. Epub 2015 Sep 14. Cogn Psychol. 2015. PMID: 26379264
-
Developmental changes in semantic knowledge organization.J Exp Child Psychol. 2016 Jun;146:202-22. doi: 10.1016/j.jecp.2016.01.005. Epub 2016 Mar 12. J Exp Child Psychol. 2016. PMID: 26974015
-
Insights into the origins of knowledge from the cognitive neuroscience of blindness.Cogn Neuropsychol. 2012;29(1-2):56-84. doi: 10.1080/02643294.2012.713342. Cogn Neuropsychol. 2012. PMID: 23017086 Review.
-
Mechanisms of theory formation in young children.Trends Cogn Sci. 2004 Aug;8(8):371-7. doi: 10.1016/j.tics.2004.06.005. Trends Cogn Sci. 2004. PMID: 15335464 Review.
Cited by
-
Category Flexibility in Emotion Learning.Affect Sci. 2023 Jun 9;4(4):722-730. doi: 10.1007/s42761-023-00192-3. eCollection 2023 Dec. Affect Sci. 2023. PMID: 38156248 Free PMC article.
-
How cultural input shapes the development of idealized biological prototypes.J Cogn Dev. 2025;26(2):221-249. doi: 10.1080/15248372.2024.2409680. Epub 2024 Nov 4. J Cogn Dev. 2025. PMID: 40757011
-
How race and gender shape the development of social prototypes in the United States.J Exp Psychol Gen. 2022 Aug;151(8):1956-1971. doi: 10.1037/xge0001164. Epub 2021 Dec 23. J Exp Psychol Gen. 2022. PMID: 34941345 Free PMC article.
-
Normative Social Role Concepts in Early Childhood.Cogn Sci. 2019 Aug;43(8):e12782. doi: 10.1111/cogs.12782. Cogn Sci. 2019. PMID: 31446654 Free PMC article.
-
Who is a typical woman? Exploring variation in how race biases representations of gender across development.Dev Sci. 2022 Mar;25(2):e13175. doi: 10.1111/desc.13175. Epub 2021 Sep 16. Dev Sci. 2022. PMID: 34468071 Free PMC article.
References
-
- Ameel E, & Storms G (2006). From prototypes to caricatures: Geometrical models for concept typicality. Journal of Memory and Language, 55(3), 402–421. 10.1016/j.jml.2006.05.005. - DOI
-
- Anglin JM (1986). Semantic and conceptual knowledge underlying the child’s words New York, NY: Springer; 83–97. 10.1007/978-1-4612-4844-6_4. - DOI
-
- Bjorklund DF, & Thompson BE (1983). Category typicality effects in children’s memory performance: Qualitative and quantitative differences in the processing of category information. Journal of Experimental Child Psychology, 35(2), 329–344. 10.1016/0022-0965(83)90086-3. - DOI
Publication types
MeSH terms
Grants and funding
LinkOut - more resources
Full Text Sources
Medical

