

Nonlinear relationships between air pollutant emissions and PM2.5-related health impacts in the Beijing-Tianjin-Hebei region
- PMID: 30677683
- PMCID: PMC7643754
- DOI: 10.1016/j.scitotenv.2019.01.169
Nonlinear relationships between air pollutant emissions and PM2.5-related health impacts in the Beijing-Tianjin-Hebei region
Abstract
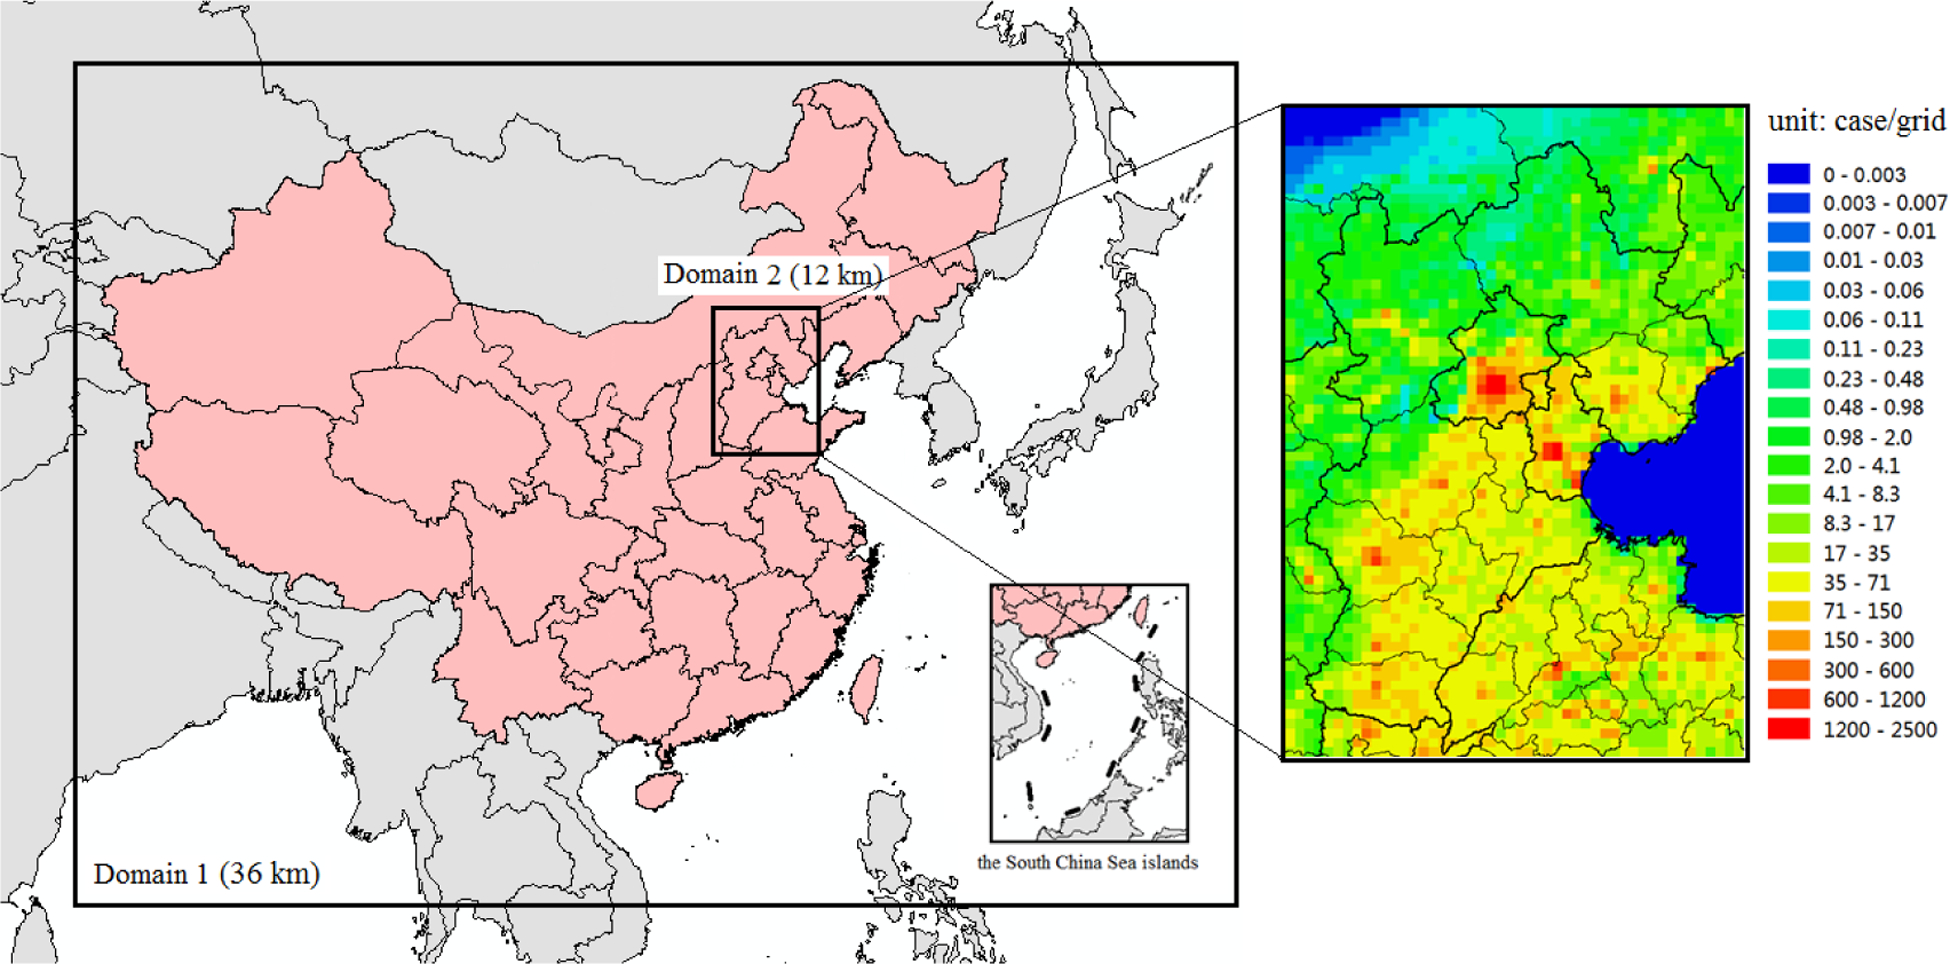
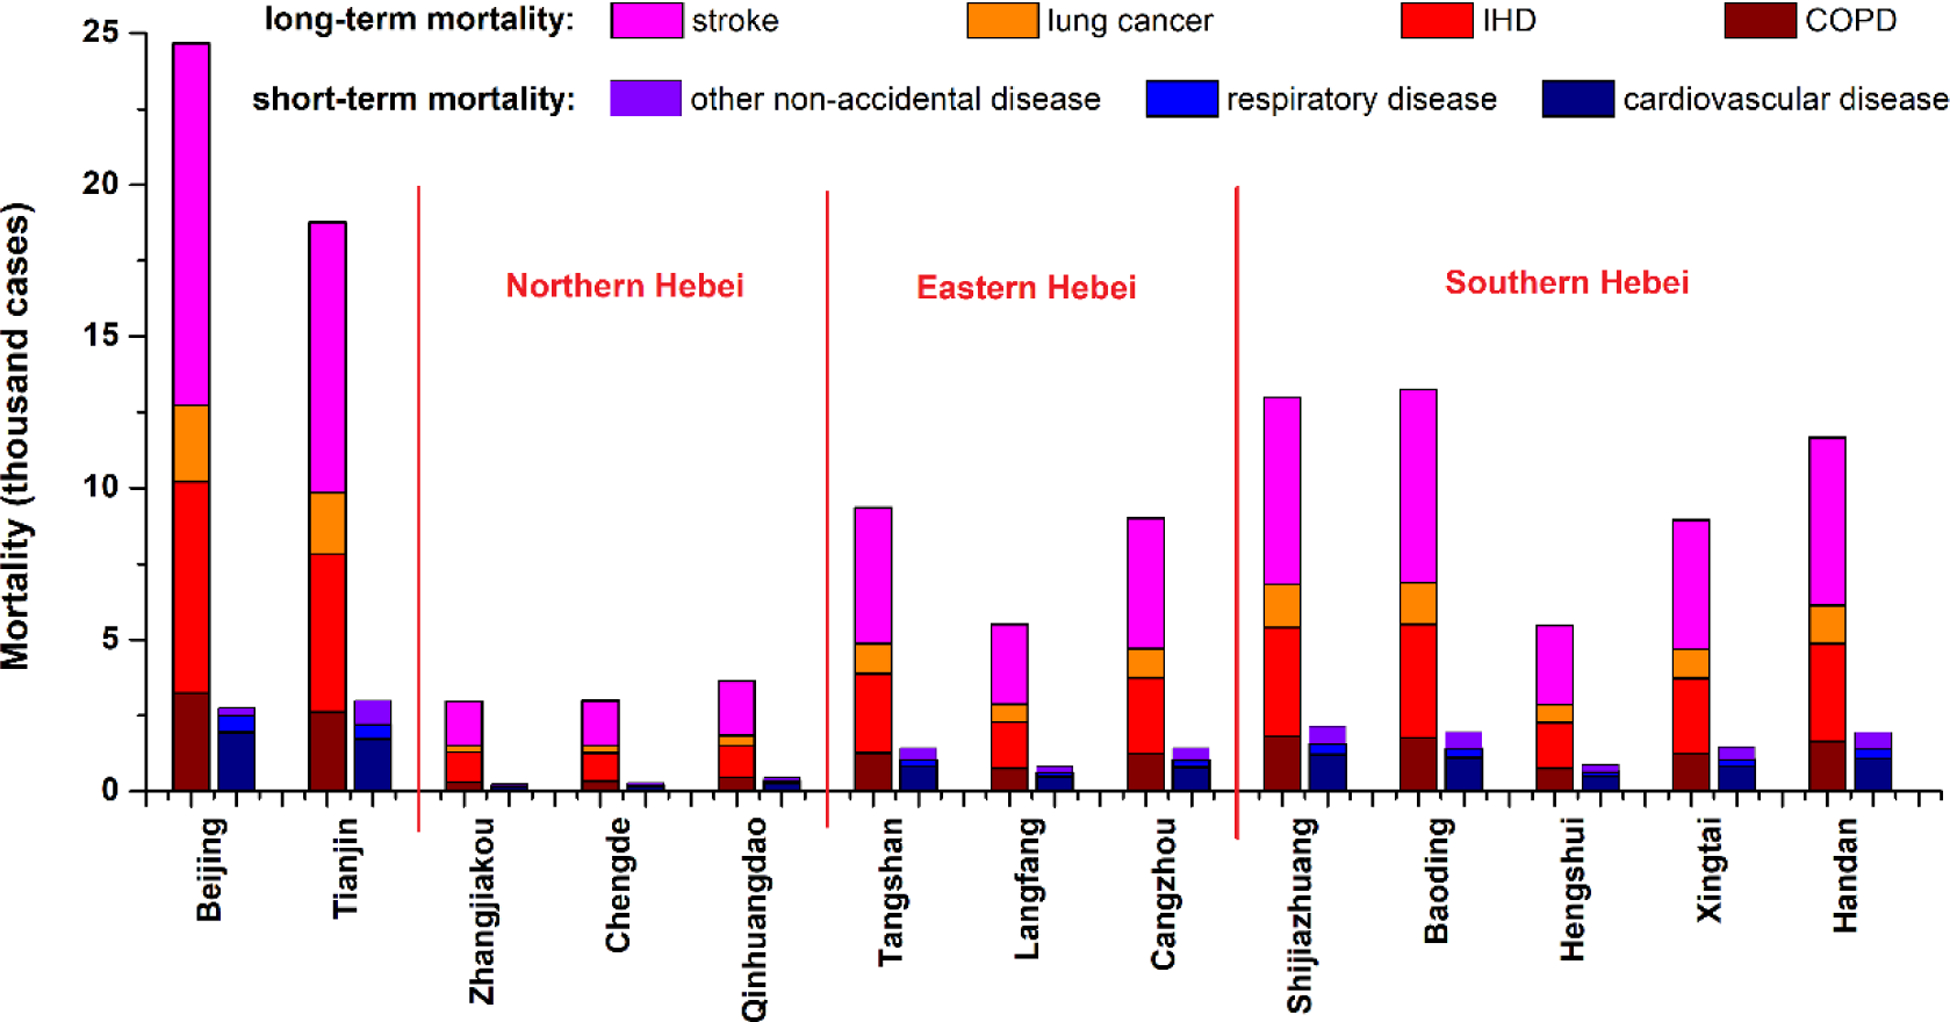
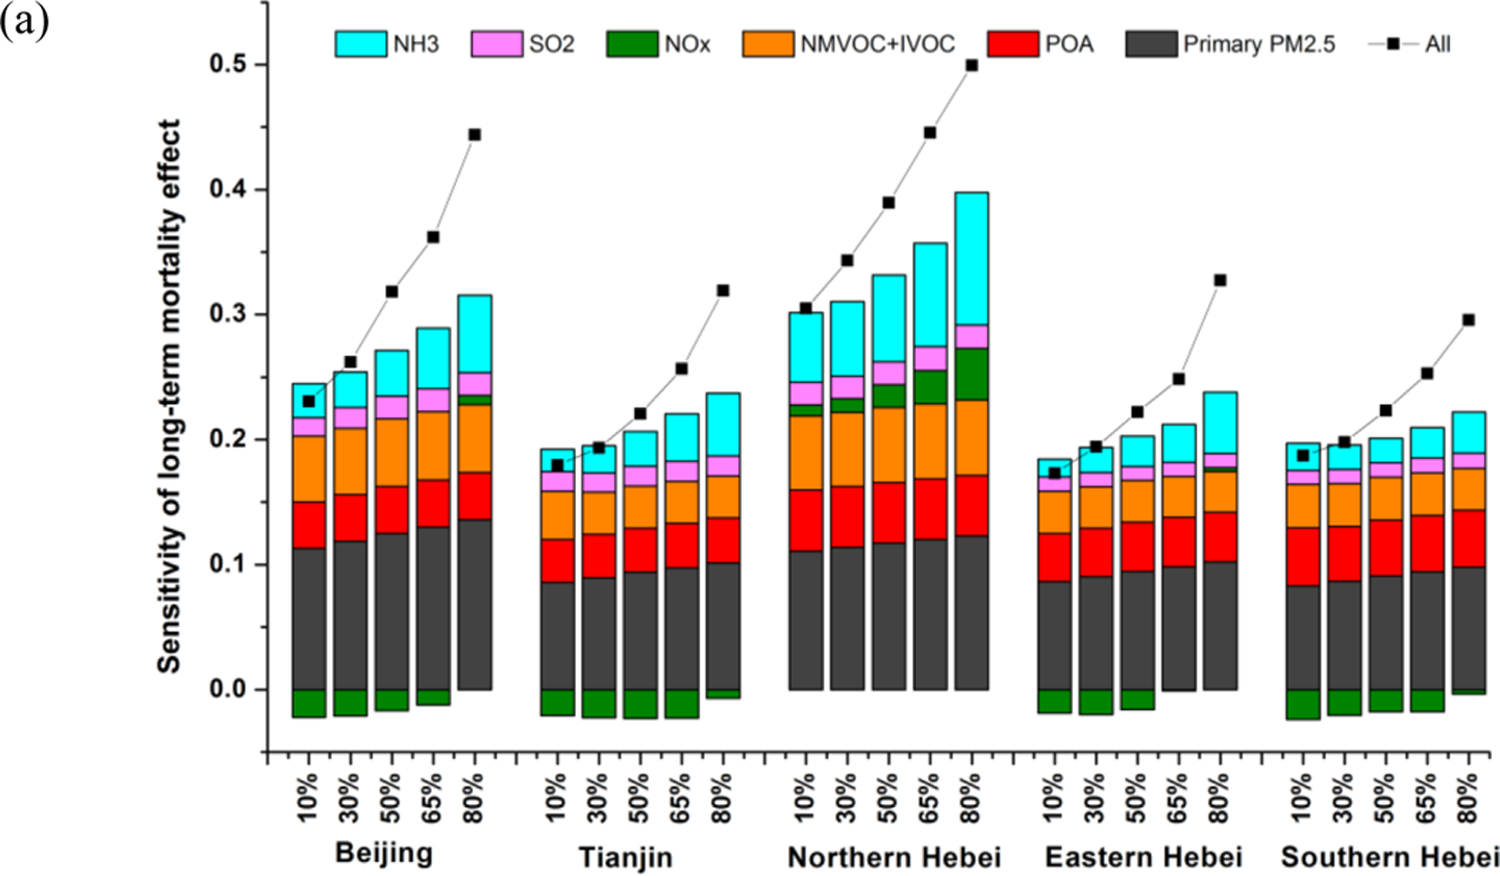
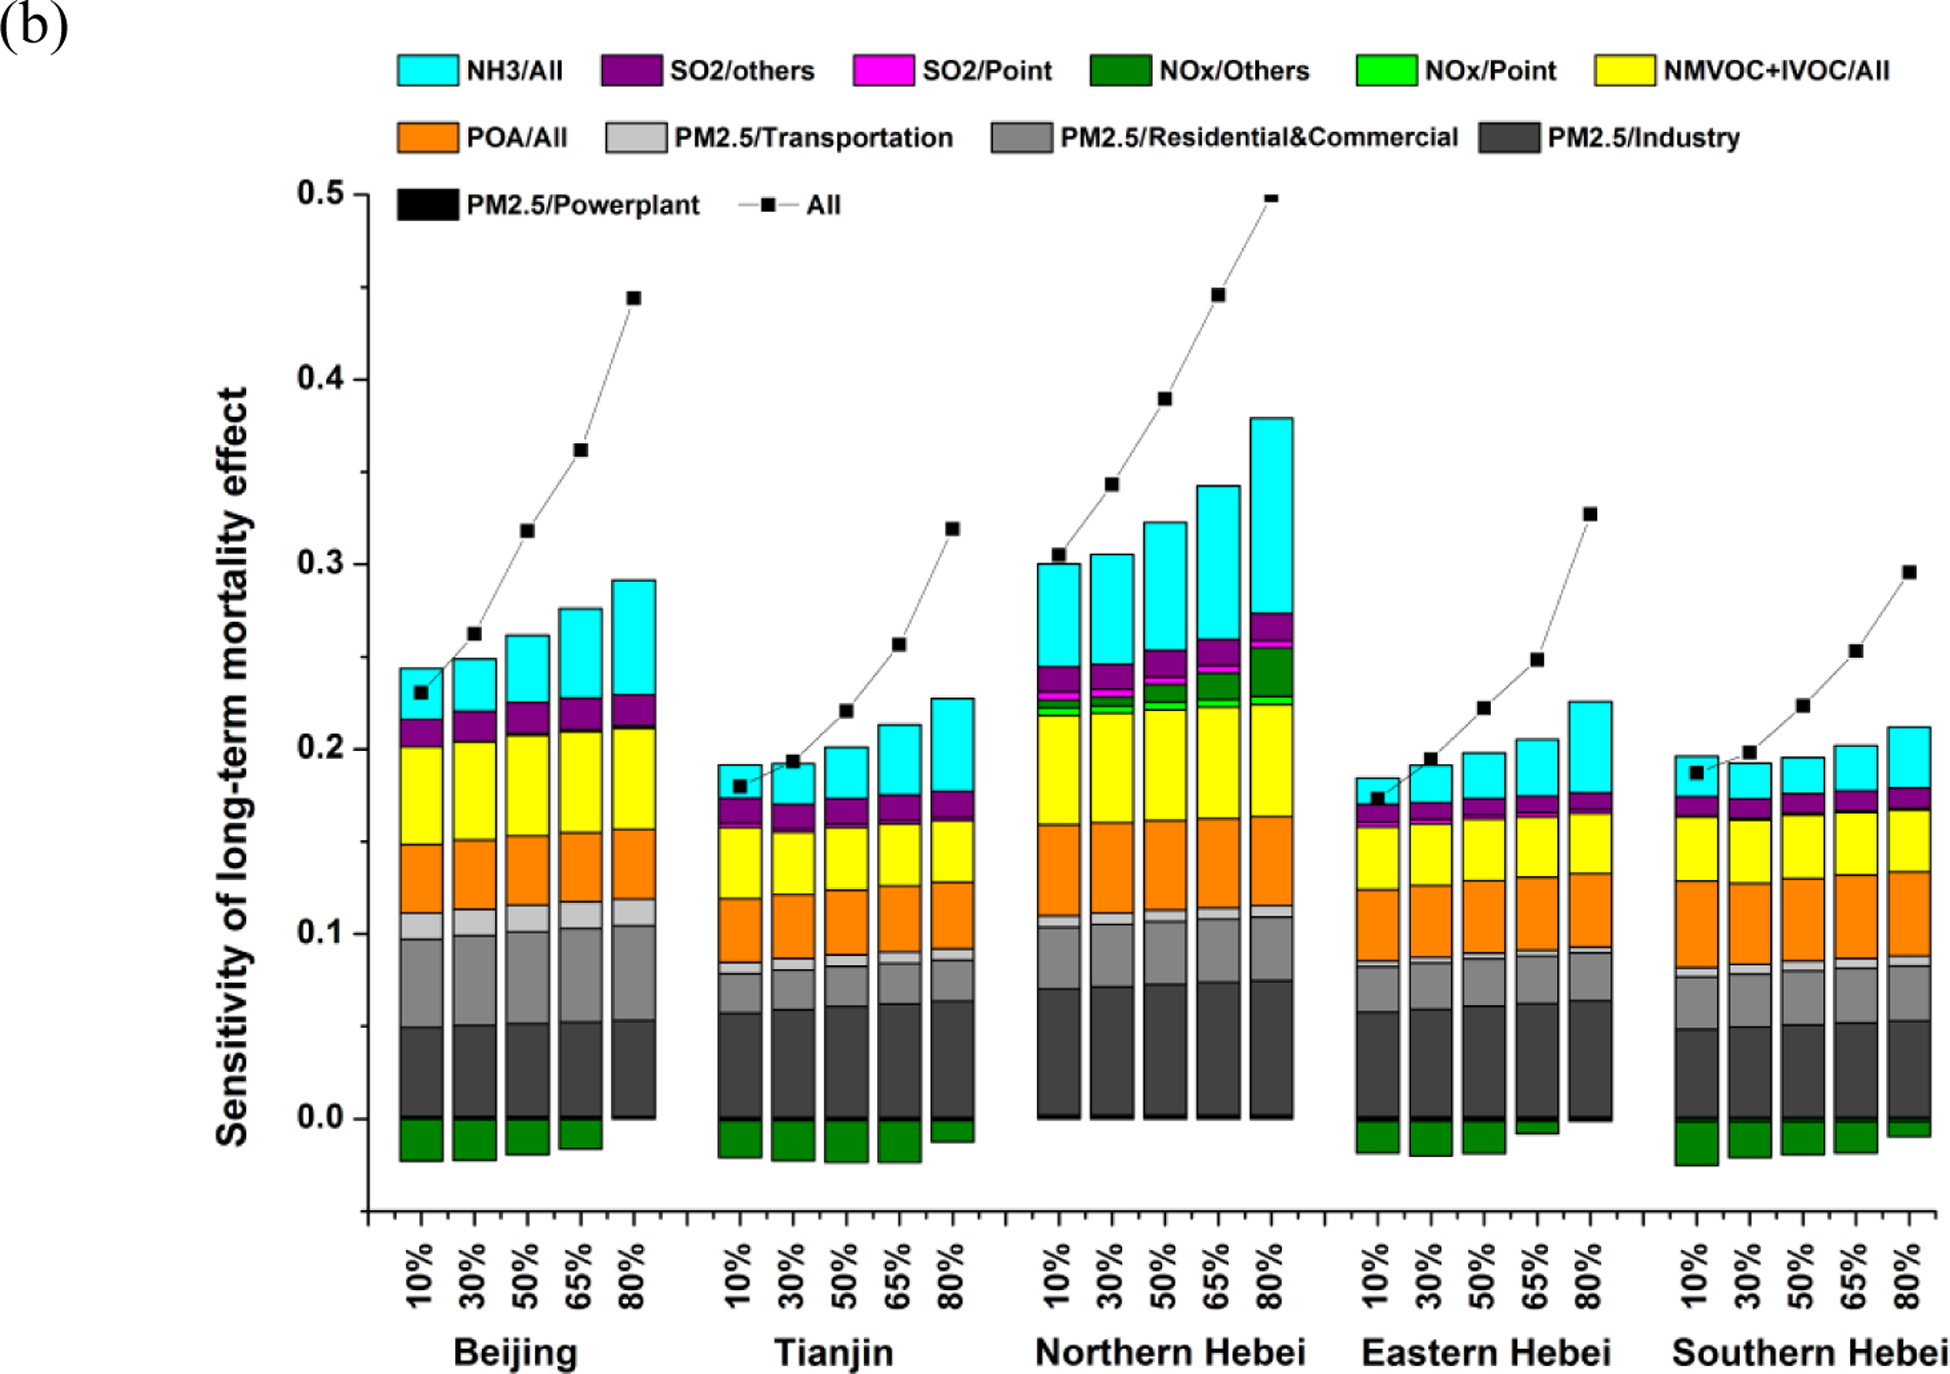
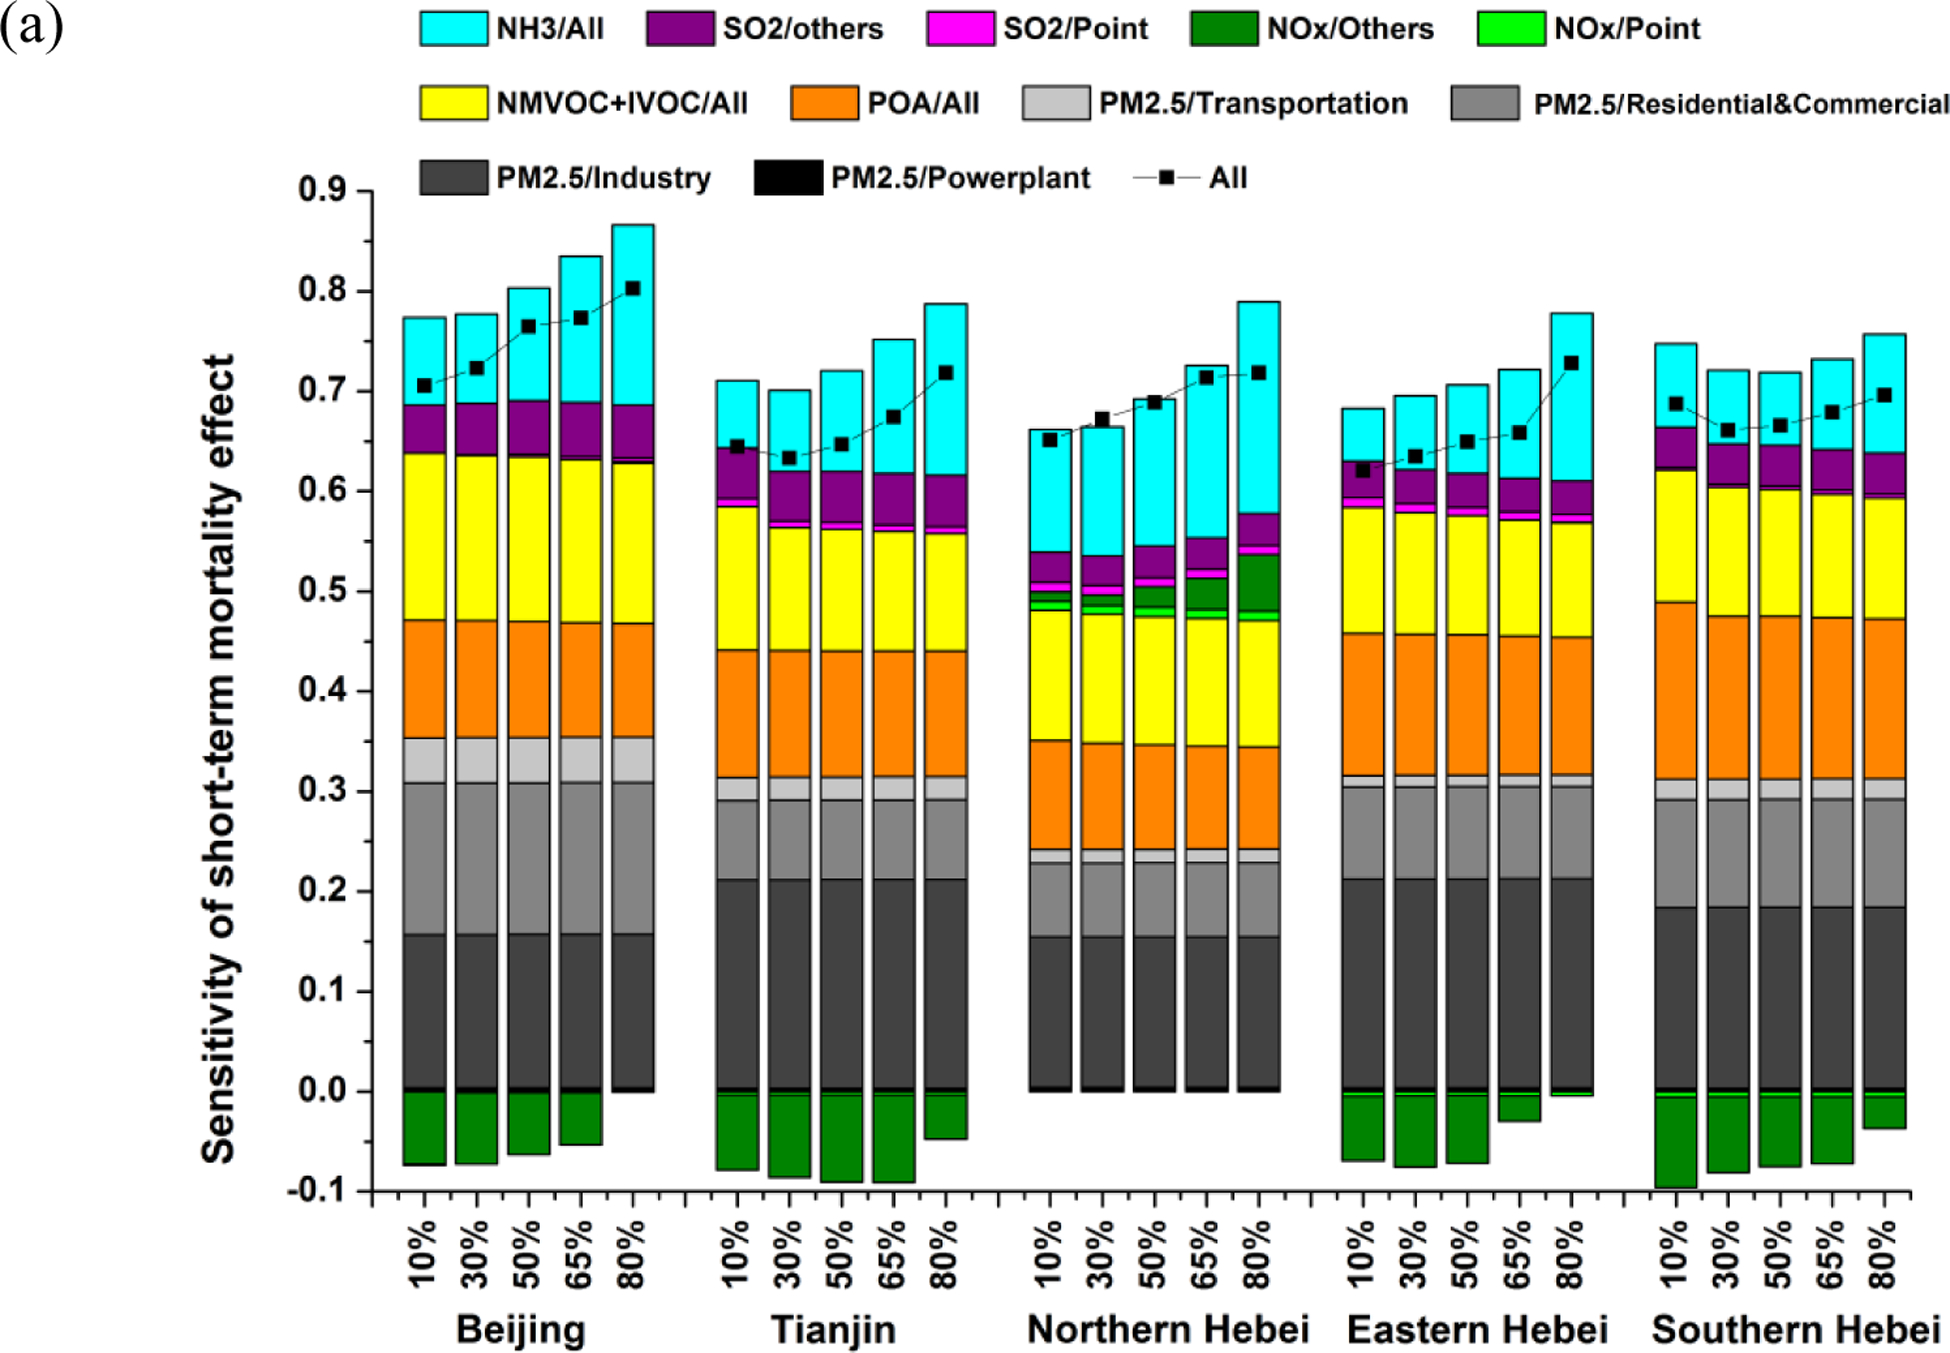
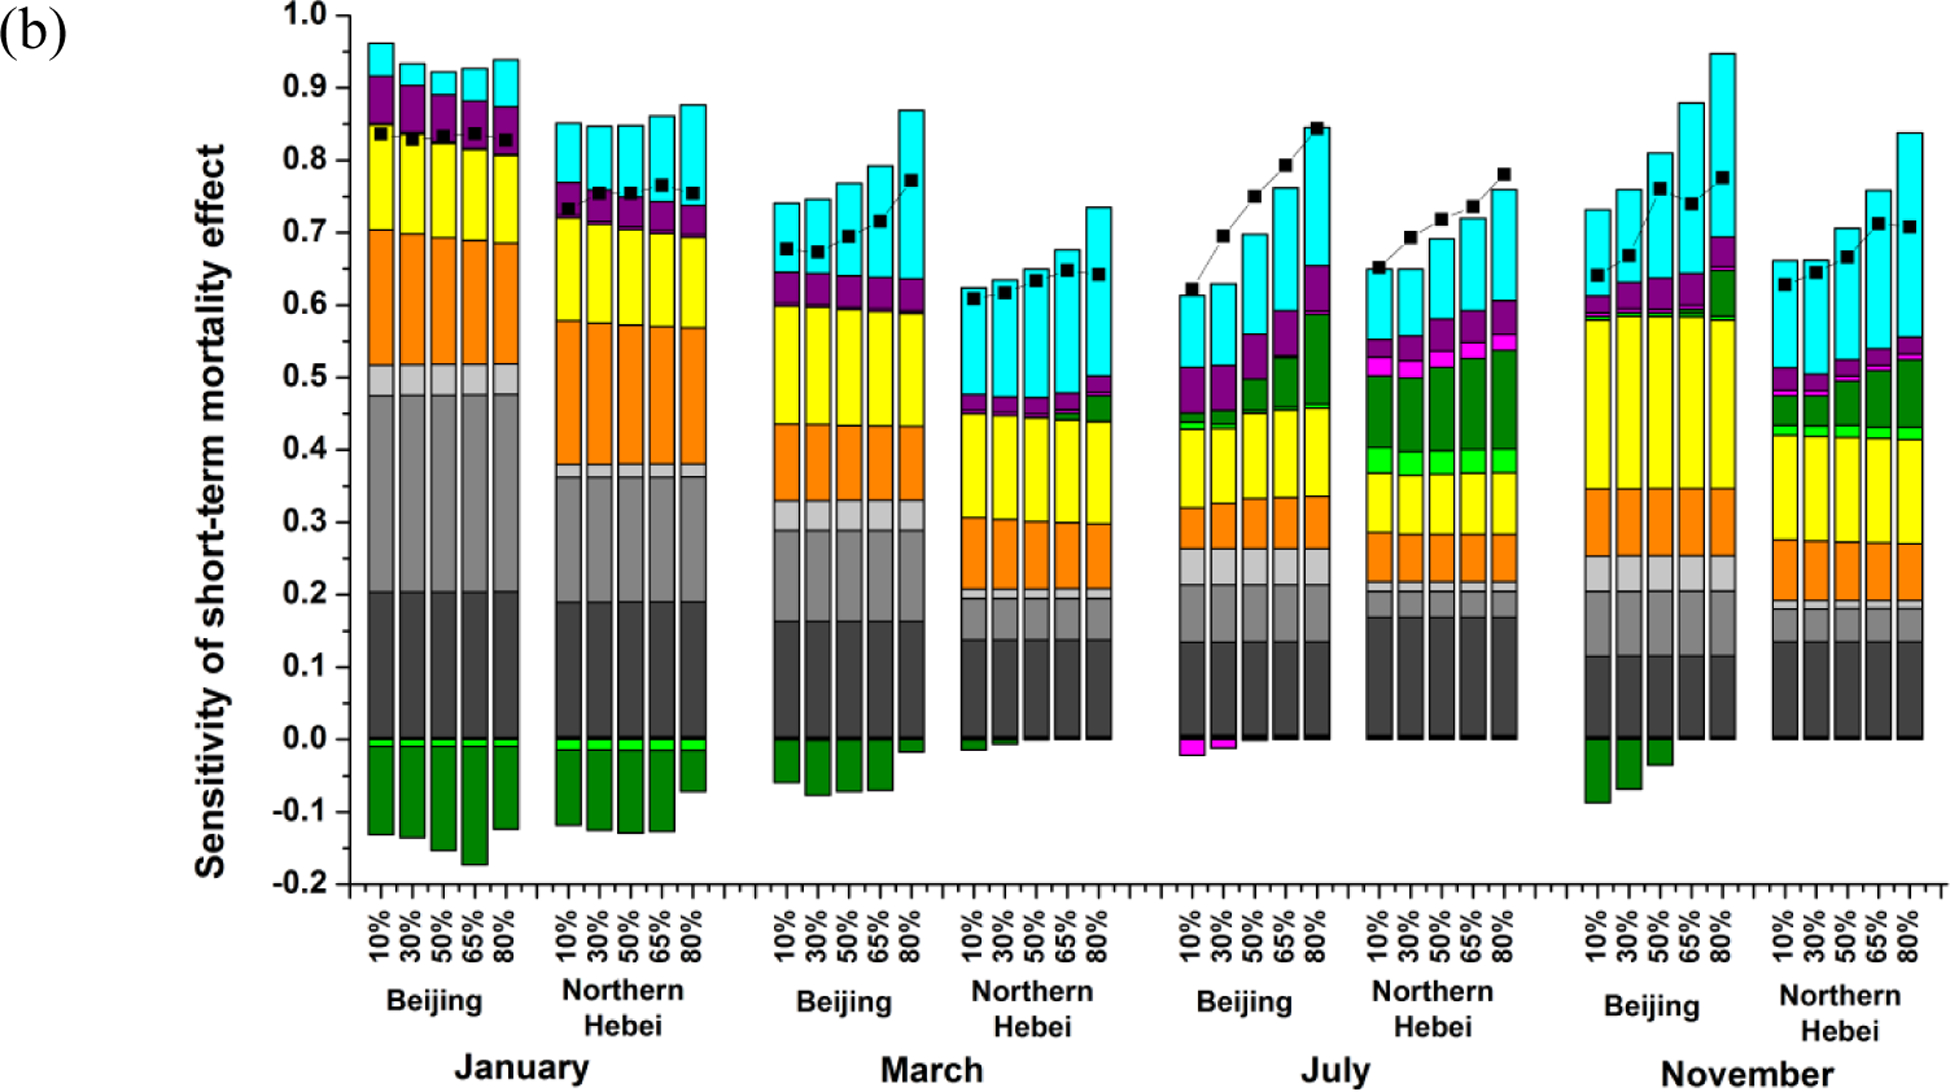
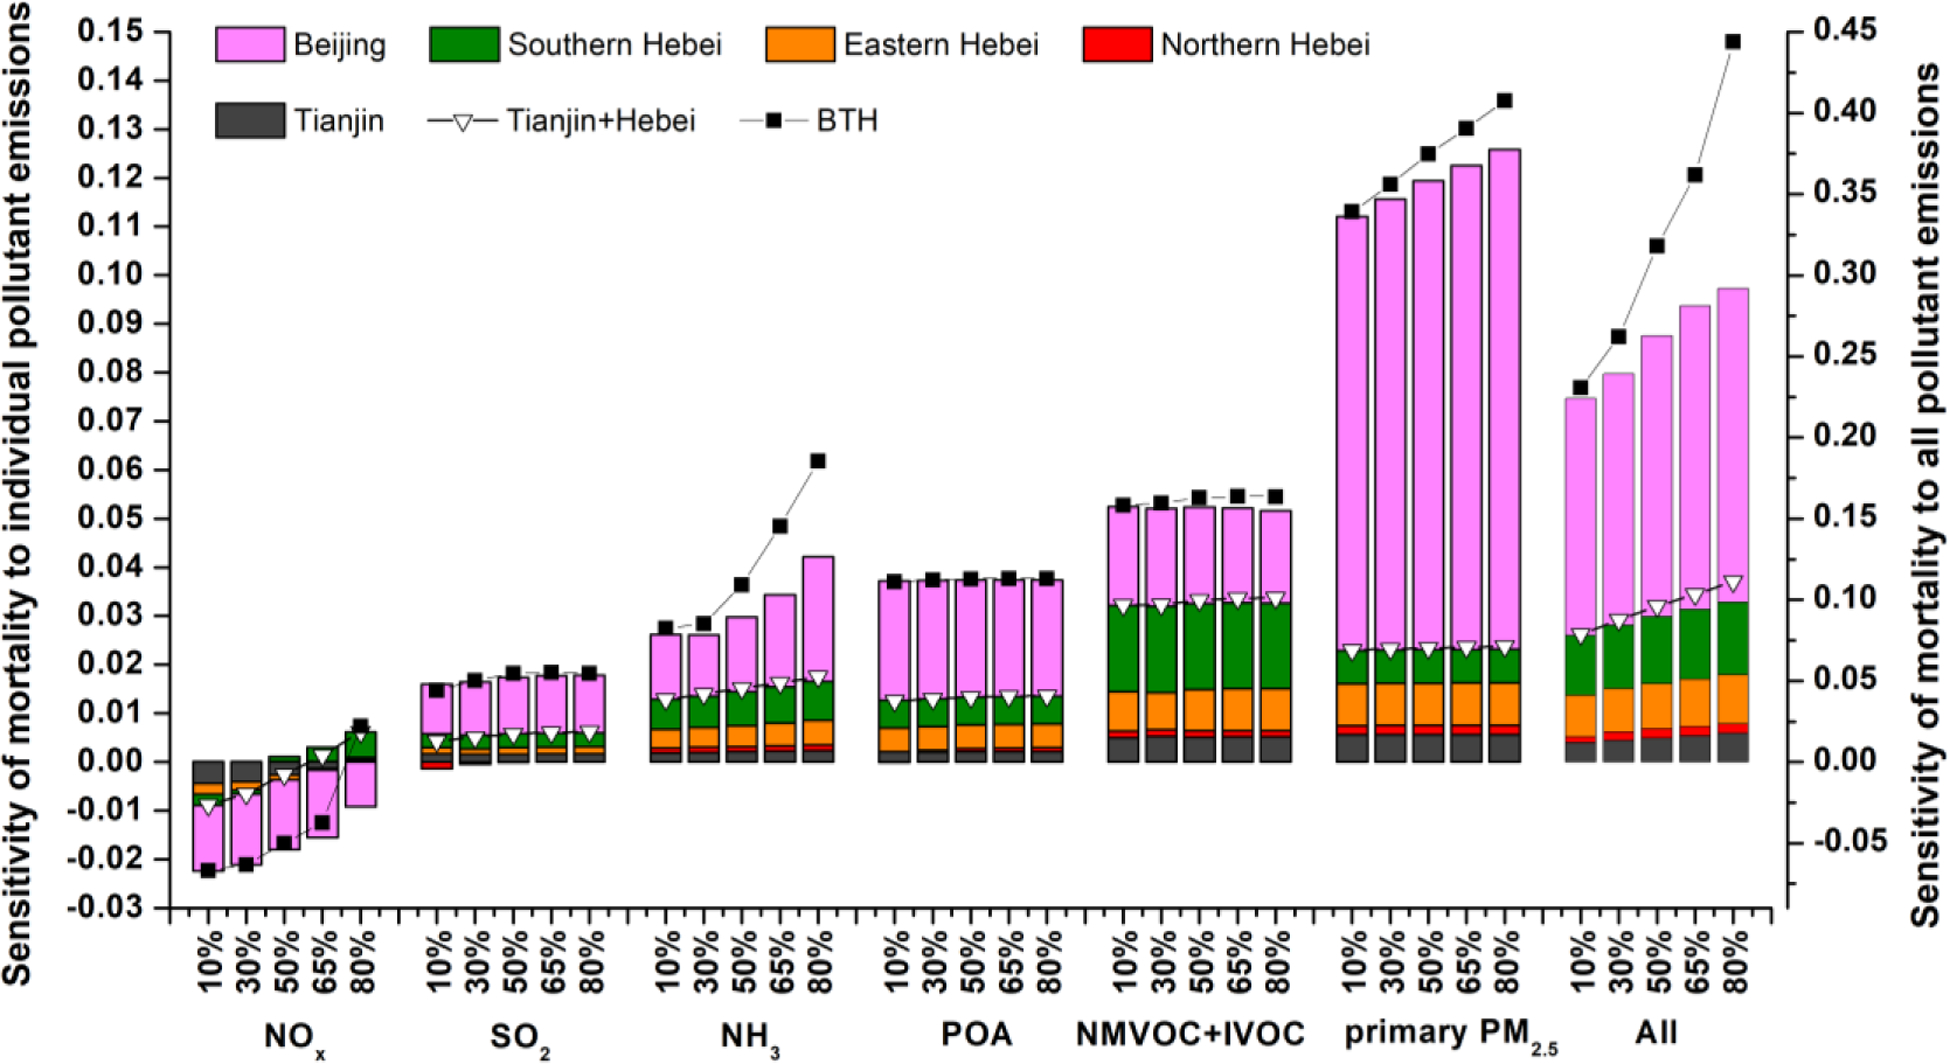
A direct and quantitative linkage of air pollution-related health effects to emissions from different sources is critically important for decision-making. While a number of studies have attributed the PM2.5-related health impacts to emission sources, they have seldom examined the complicated nonlinear relationships between them. Here we investigate the nonlinear relationships between PM2.5-related premature mortality in the Beijing-Tianjin-Hebei (BTH) region, one of the most polluted regions in the world, and emissions of different pollutants from multiple sectors and regions, through a combination of chemical transport model (CTM), extended response surface model (ERSM), and concentration-response functions (CRFs). The mortalities due to both long-term and short-term exposures to PM2.5 are most sensitive to the emission reductions of primary PM2.5, followed by NH3, nonmethane volatile organic compounds and intermediate volatility organic compounds (NMVOC+IVOC). The sensitivities of long-term mortality to emissions of primary organic aerosol (POA), NMVOC+IVOC and SO2 do not change much with reduction ratio, whereas the sensitivities to primary inorganic PM2.5 (defined as all chemical components of primary PM2.5 other than POA), NH3 and NOx increase significantly with the increase of reduction ratio. The emissions of primary PM2.5, especially those from the residential and commercial sectors, contribute a larger fraction of mortality in winter (57-70%) than in other seasons (28-42%). When emissions of multiple pollutants or those from both local and regional emissions are controlled simultaneously, the overall sensitivity of long-term mortality is much larger than the arithmetic sum of the sensitivities to emissions of individual pollutants or from individual regions. This implies that a multi-pollutant, multi-sector and regional joint control strategy should be implemented to maximize the marginal health benefits. For NOx emissions, we suggest a nationwide control strategy which significantly enhances the effectiveness for reducing mortality by avoiding possible side effects when only the emissions within the BTH region are reduced.
Keywords: CMAQ/2D-VBS; China; PM(2.5); extended response surface model (ERSM); premature mortality.
Copyright © 2019 Elsevier B.V. All rights reserved.
Figures
References
-
- Andersson C, Bergstrom R, and Johansson C: Population exposure and mortality due to regional background PM in Europe - Long-term simulations of source region and shipping contributions, Atmos. Environ, 43, 3614–3620, 10.1016/j.atmosenv.2009.03.040, 2009. - DOI
-
- Burnett RT, Pope CA, Ezzati M, Olives C, Lim SS, Mehta S, Shin HH, Singh G, Hubbell B, Brauer M, Anderson HR, Smith KR, Balmes JR, Bruce NG, Kan HD, Laden F, Pruss-Ustun A, Michelle CT, Gapstur SM, Diver WR, and Cohen A: An Integrated Risk Function for Estimating the Global Burden of Disease Attributable to Ambient Fine Particulate Matter Exposure, Environ. Health. Persp, 122, 397–403, Doi 10.1289/Ehp.1307049, 2014. - DOI - PMC - PubMed
-
- Chang X, Wang SX, Zhao B, Cai SY, and Hao JM: Assessment of inter-city transport of particulate matter in the Beijing-Tianjin-Hebei region, Atmos. Chem. Phys, 18, 4843–4858, 10.5194/acp-18-4843-2018, 2018. - DOI
MeSH terms
Substances
Grants and funding
LinkOut - more resources
Full Text Sources
