

Toward Optimizing cVEMP: 2,000-Hz Tone Bursts Improve the Detection of Superior Canal Dehiscence
- PMID: 30677753
- PMCID: PMC6469487
- DOI: 10.1159/000493721
Toward Optimizing cVEMP: 2,000-Hz Tone Bursts Improve the Detection of Superior Canal Dehiscence
Abstract
Background: The cervical vestibular evoked myogenic potential (cVEMP) test measures saccular and inferior vestibular nerve function. The cVEMP can be elicited with different frequency stimuli and interpreted using a variety of metrics. Patients with superior semicircular canal dehiscence (SCD) syndrome generally have lower cVEMP thresholds and larger amplitudes, although there is overlap with healthy subjects. The aim of this study was to evaluate which metric and frequency best differentiate healthy ears from SCD ears using cVEMP.
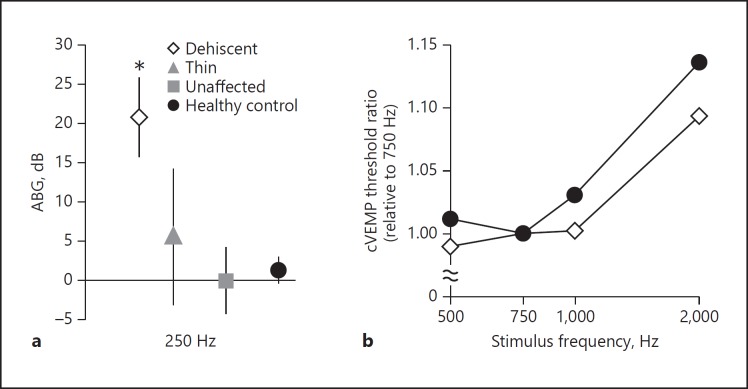
Methods: Twenty-one patients with SCD and 23 age-matched controls were prospectively included and underwent cVEMP testing at 500, 750, 1,000 and 2,000 Hz. Sound level functions were obtained at all frequencies to acquire threshold and to calculate normalized peak-to-peak amplitude (VEMPn) and VEMP inhibition depth (VEMPid). Third window indicator (TWI) metrics were calculated by subtracting the 250-Hz air-bone gap from the ipsilateral cVEMP threshold at each frequency. Ears of SCD patients were divided into three groups based on CT imaging: dehiscent, thin or unaffected. The ears of healthy age-matched control subjects constituted a fourth group.
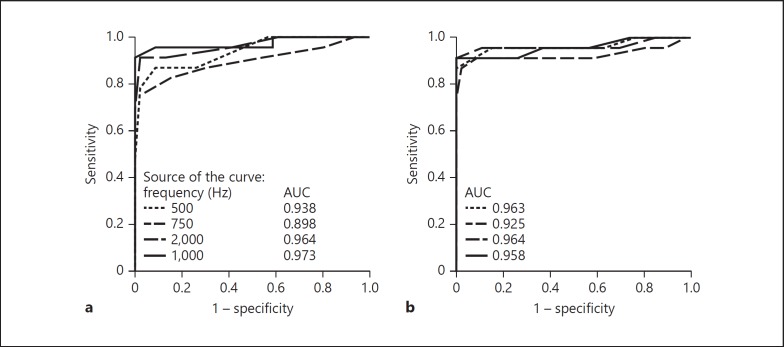
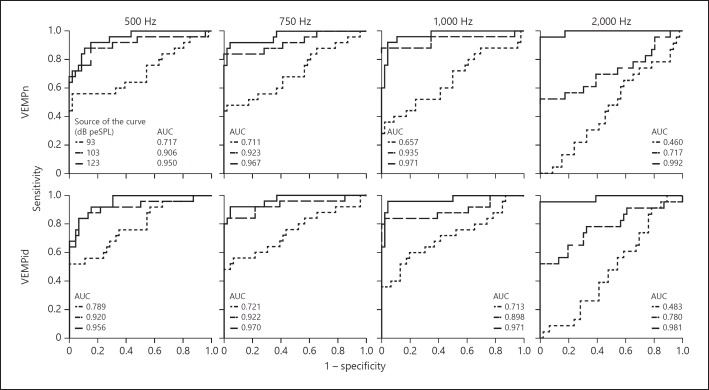
Results: Comparing metrics at all frequencies revealed that 2,000-Hz stimuli were most effective in differentiating SCD from normal ears. ROC analysis indicated that for both 2,000-Hz cVEMP threshold and for 2,000-Hz TWI, 100% specificity could be achieved with a sensitivity of 92.0%. With 2,000-Hz VEMPn and VEMPid at the highest sound level, 100% specificity could be achieved with a sensitivity of 96.0%.
Conclusion: The best diagnostic accuracy of cVEMP in SCD patients can be achieved with 2,000-Hz tone burst stimuli, regardless of which metric is used.
Keywords: Cervical vestibular evoked myogenic potential; Superior canal dehiscence; Vestibular nerve function.
© 2019 The Author(s) Published by S. Karger AG, Basel.
Figures


References
-
- Benamira LZ, Alzahrani M, Saliba I. Superior canal dehiscence: can we predict the diagnosis? Otol Neurotol. 2014 Feb;35((2)):338–43. - PubMed
-
- Brantberg K. Vestibular evoked myogenic potentials (VEMPs): usefulness in clinical neurotology. Semin Neurol. 2009 Nov;29((5)):541–7. - PubMed
-
- Brantberg K, Bergenius J, Tribukait A, Krister Brantberg, Johan Bergenius. Vestibular-evoked myogenic potentials in patients with dehiscence of the superior semicircular canal. Acta Otolaryngol. 1999;119((6)):633–40. - PubMed
-
- Brantberg K, Verrecchia L. Testing vestibular-evoked myogenic potentials with 90-dB clicks is effective in the diagnosis of superior canal dehiscence syndrome. Audiol Neurotol. 2009;14((1)):54–8. - PubMed
Publication types
MeSH terms
Grants and funding
LinkOut - more resources
Full Text Sources
Miscellaneous
