. 2019 Jan 22;11(2):237.
doi: 10.3390/nu11020237.

Deciphering the Molecular Mechanisms Sustaining the Estrogenic Activity of the Two Major Dietary Compounds Zearalenone and Apigenin in ER-Positive Breast Cancer Cell Lines

Affiliations

Deciphering the Molecular Mechanisms Sustaining the Estrogenic Activity of the Two Major Dietary Compounds Zearalenone and Apigenin in ER-Positive Breast Cancer Cell Lines

Sylvain Lecomte et al. Nutrients. .

Abstract

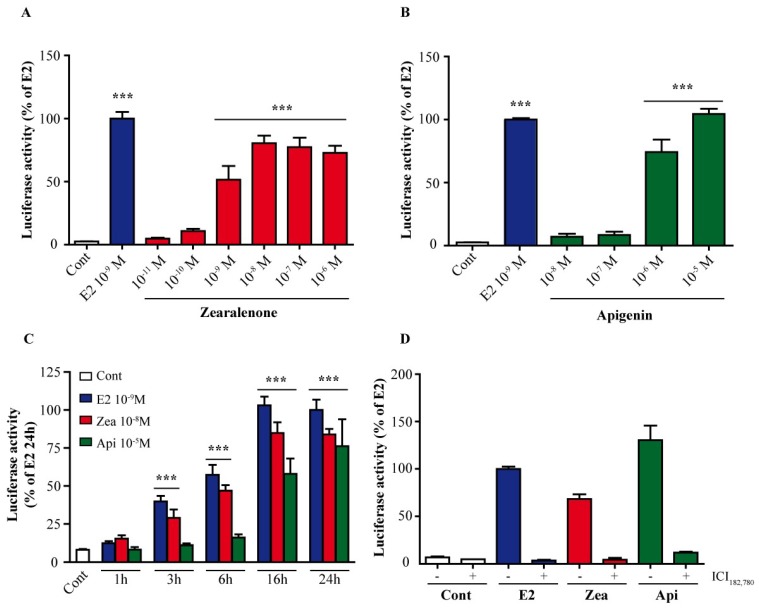
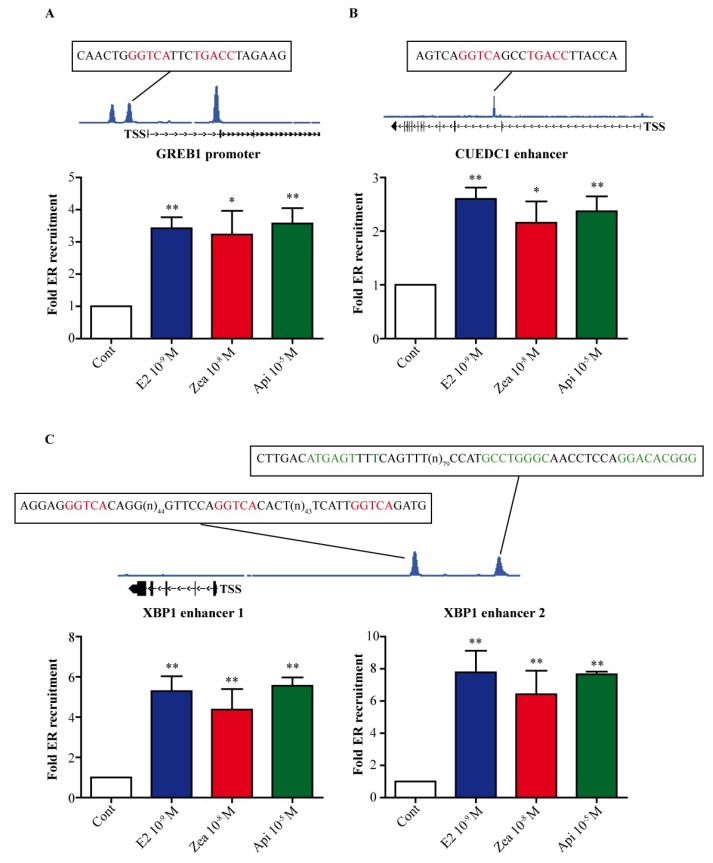
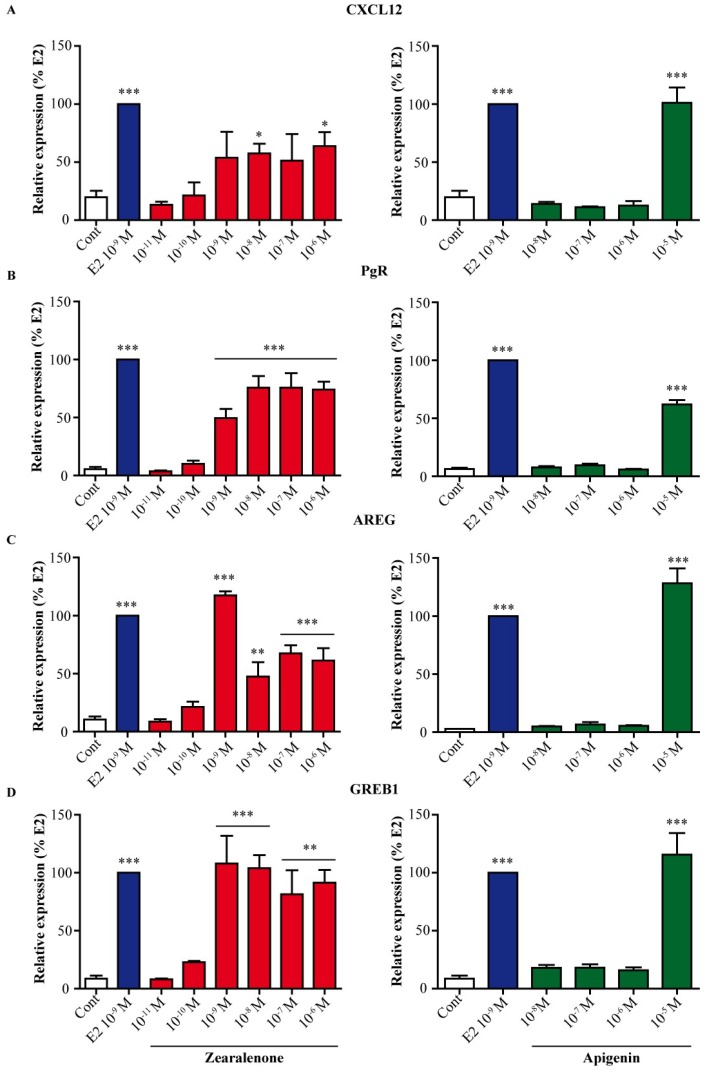
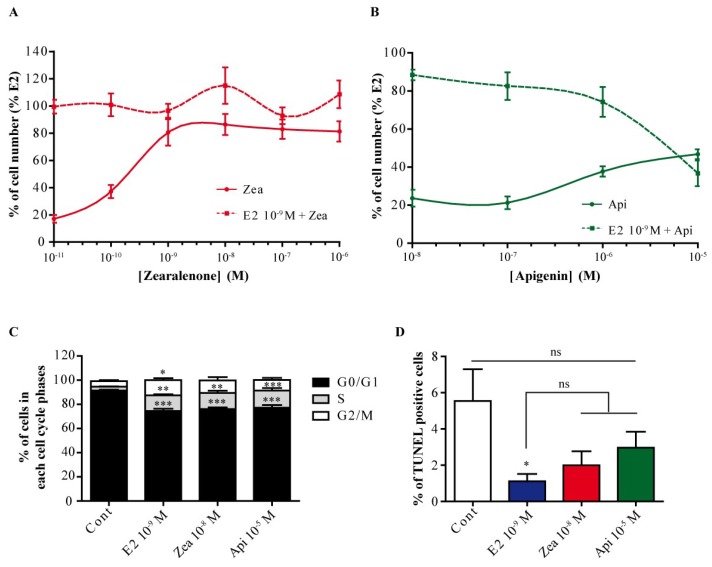
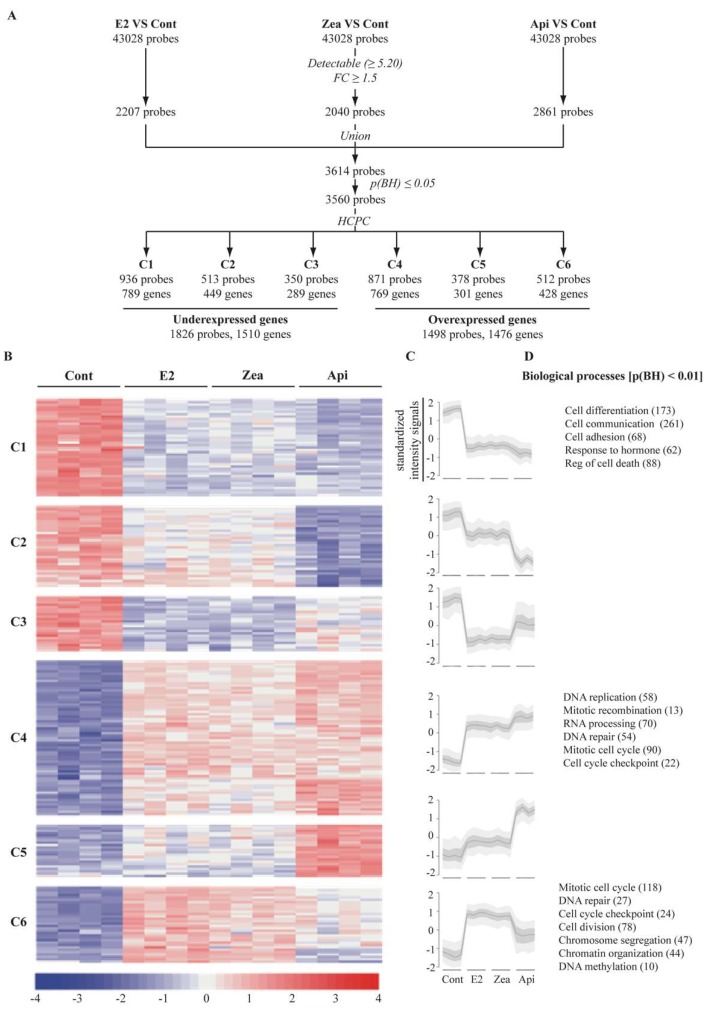
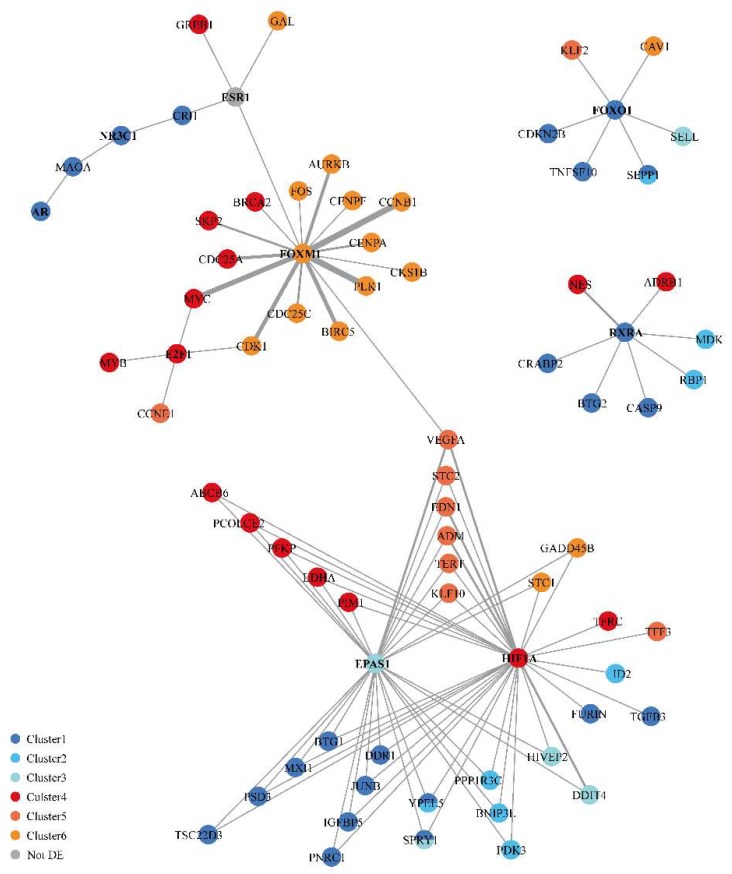
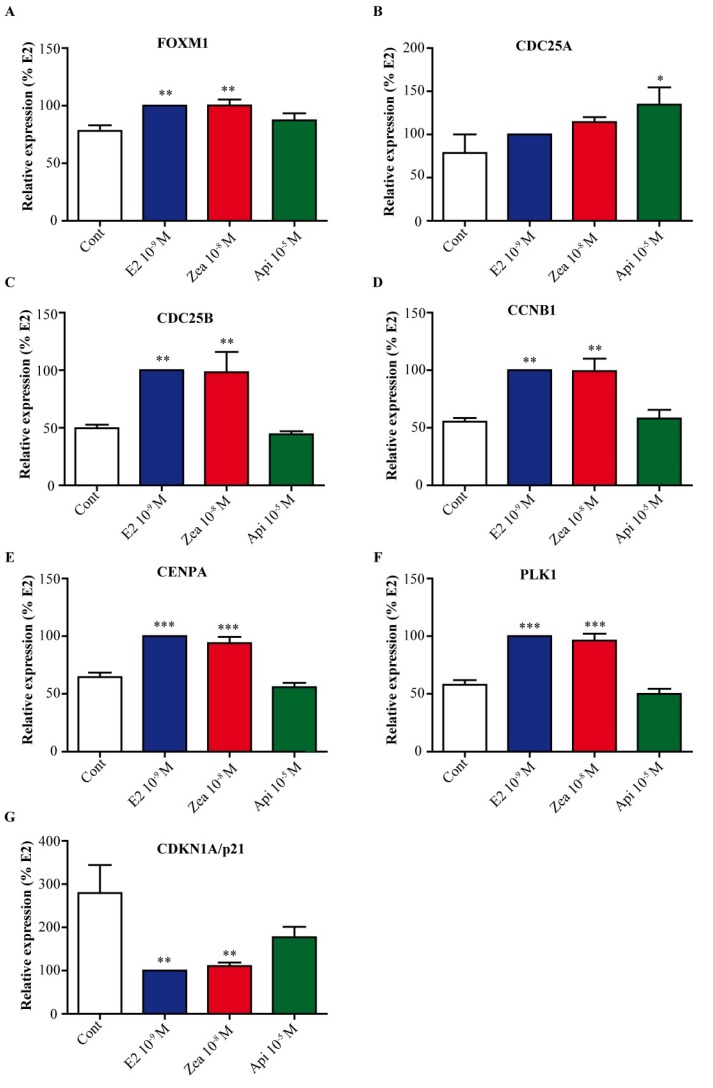
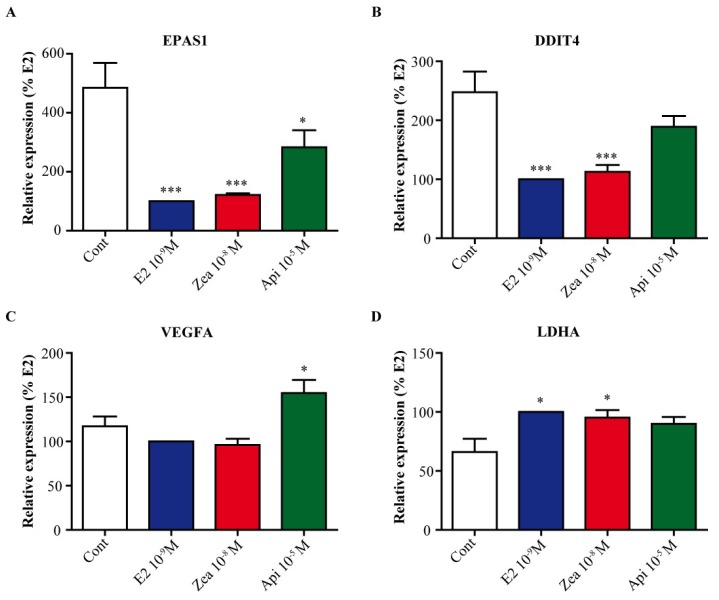
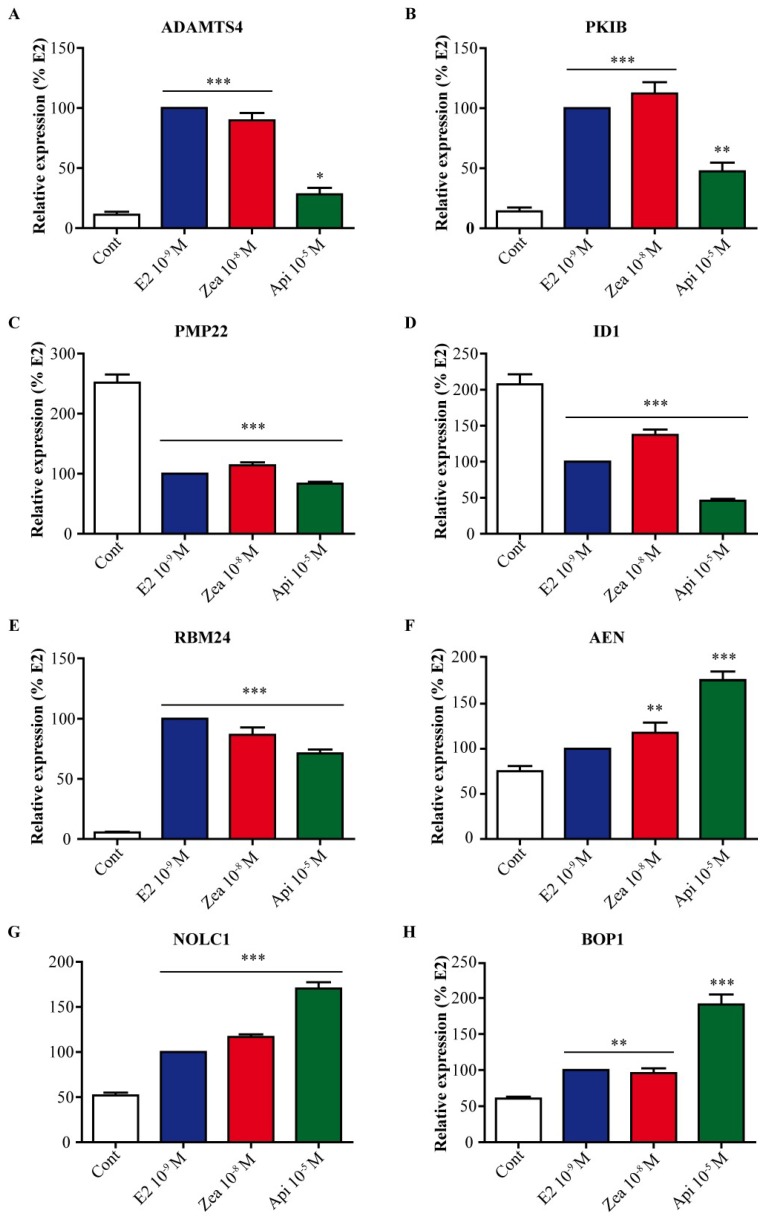
The flavone apigenin and the mycotoxin zearalenone are two major compounds found in the human diet which bind estrogen receptors (ERs), and therefore influence ER activity. However, the underlying mechanisms are not well known. To unravel the molecular mechanisms that could explain the differential effect of zearalenone and apigenin on ER-positive breast cancer cell proliferation, gene-reporter assays, chromatin immunoprecipitation (ChIP) experiments, proliferation assays and transcriptomic analysis were performed. We found that zearalenone and apigenin transactivated ERs and promoted the expression of estradiol (E2)-responsive genes. However, zearalenone clearly enhanced cellular proliferation, while apigenin appeared to be antiestrogenic in the presence of E2 in both ER-positive breast cancer cell lines, MCF-7 and T47D. The transcriptomic analysis showed that both compounds regulate gene expression in the same way, but with differences in intensity. Two major sets of genes were identified; one set was linked to the cell cycle and the other set was linked to stress response and growth arrest. Our results show that the transcription dynamics in gene regulation induced by apigenin were somehow different with zearalenone and E2 and may explain the differential effect of these compounds on the phenotype of the breast cancer cell. Together, our results confirmed the potential health benefit effect of apigenin, while zearalenone appeared to be a true endocrine-disrupting compound.

Keywords: breast cancer; dietary compounds; endocrine disruption; estrogen receptor; gene expression.


Conflict of interest statement

The authors declare they have no actual or potential competing financial interests.

Figures

Figure 1
Figure 1
Effect of zearalenone and apigenin on estrogen receptor (ER) activation. MCF-7 cells were transfected with an estrogen-responsive element-thymidine kinase (ERE-TK)-luciferase reporter plasmid and a cytomegalo virus (CMV)-β galactosidase plasmid as a control for transfection efficiency. Then, cells were treated with solvent as a negative control (white), 10−9 M E2 as a positive control (blue) or various doses of zearalenone (red) (A) or apigenin (green) (B) for 24 h. The results are expressed as the percentage of luciferase activity attained with E2 treatment and are the means ± standard error of the mean (SEM) of three to four independent experiments. Cells were treated with solvent as a negative control (white), 10-9 M E2 as a positive control (blue), 10−8 M zearalenone (red) or 10−5 M apigenin (green) for 1 h, 3 h, 6 h, 16 h and 24 h (C). The results are expressed as the percentage of luciferase activity attained with E2 treatment at 24 h and are the means ± SEM of three independent experiments. (D) To confirm the estrogenic effects of apigenin and zearalenone, transfected cells were cotreated with 10−6 M ICI182,780 and either 10−9 M E2 (blue) or 10−8 M zearalenone (red) or 10−5 M apigenin (green). *** indicates a p-value < 0.001 by one-way analysis of variance (ANOVA) followed by Dunnett’s post hoc test for comparison of the control treatment with the other treatments.
Figure 2
Figure 2
ERα recruitment to chromatin at distinct ER binding sites in response to E2, zearalenone and apigenin. MCF-7 cells were treated with solvent (white) as a negative control, 10−9 M E2 (blue) as a positive control, 10−8 M zearalenone (red) or 10−5 M apigenin (green) for 1 h. The recruitment of ERα to the GREB1 promoter (A), CUE domain containing 1 (CUEDC1) enhancer (B) and the two enhancers of x-box protein 1 (XBP1) (C) was assessed by chromatin immunoprecipitation followed by real-time PCR. For each binding site tested, the DNA sequence is indicated. The results are expressed in fold recruitment compared to control and are the means of four independent experiments. * indicates a p-value < 0.05 and ** indicates a p-value < 0.01 by one-way ANOVA followed by Dunnett’s post hoc test for comparison of the control treatment with the other treatments.
Figure 3
Figure 3
Effect of zearalenone and apigenin on the expression of endogenous E2 target genes. MCF-7 cells were treated with solvent (white) as a negative control, 10−9 M E2 (blue) as a positive control or with various doses of zearalenone (red) or apigenin (green) for 24 h. The expression of CXCL12 (A), PgR (B), AREG (C) and GREB1 (D) was assessed by real-time PCR. The expression level of each gene was normalized to the expression levels of the housekeeping genes GAPDH and TBP. The results are expressed as the percentage of the relative expression of transcripts obtained in E2-treated cells and are the means ± SEM of three independent experiments. * indicates a p-value < 0.05, ** indicates a p-value < 0.01, and *** indicates a p-value < 0.001 by one-way ANOVA followed by Dunnett’s post hoc test for comparison of the control treatment with the other treatments.
Figure 4
Figure 4
Effect of zearalenone and apigenin on MCF-7 proliferation. MCF-7 cells were treated with various doses of zearalenone (A) or apigenin (B) alone (solid lane) or in combination with 10−9 M E2 (dotted line) for 6 days, and the cell number was determined by counting. The results are expressed as the percentage of the cell numbers counted after E2 treatment and are the means ± SEM of three to four independent experiments. For the cell cycle (C) and apoptosis (D) assays, MCF-7 cells were treated for 3 days with 10−9 M E2, 10−8 M zearalenone or 10−5 M apigenin. The cell cycle was analyzed by flow cytometry after propidium iodide staining. The results are expressed as the percentage of cells in each phase of the cell cycle and are the means ± SEM of three to four independent experiments. Apoptosis analysis was performed by a terminal deoxynucleotidyl dUTP nick end labeling (TUNEL) assay, and the percentage of apoptotic cells was assessed with an Array Scan VTI. The results are expressed as the percentage of TUNEL-positive cells. ns indicates a non-significative p-value, * indicates a p-value < 0.05, ** indicates a p-value < 0.01, and *** indicates a p-value < 0.001 by one-way ANOVA followed by Dunnett’s post hoc test for comparison of the control treatment with the other treatments.
Figure 5
Figure 5
Transcriptomic analysis, selection and clustering of differentially expressed genes. MCF-7 cells were treated with solvent (Cont), 10−9 M E2, 10−8 M zearalenone (Zea) or 10−5 M apigenin (Api) for 24 h. Total RNA was extracted, reverse transcribed, labeled and spotted onto a DNA chip. (A) To select differentially expressed genes, each treatment was compared to the control, and all probes with both an intensity signal above the overall median and a fold change ≥ 1.5 were chosen. Then, the probes were combined and submitted to a LIMMA test; only probes with a p-value < 0.05 were selected, resulting in a total of 1510 underexpressed genes and 1498 overexpressed genes. (B) These genes were clustered into 6 clusters depending on their expression patterns. (C) Intensity signals were standardized, and the expression profile of each cluster is presented. Major biological processes significantly associated (p-value < 0.01) with the different clusters are noted (D). The number of differentially expressed genes corresponding to each gene ontology (GO) term are indicated in parentheses.
Figure 6
Figure 6
Gene regulation network built from the transcript profiling data and regulation data.
Figure 7
Figure 7
Validation of cell cycle-associated genes linked to forkhead box M1 (FOXM1). MCF-7 cells were treated with solvent (white) as a negative control, 10−9 M E2 (blue) as a positive control, 10−8 M zearalenone (red) or 10−5 M apigenin (green) for 24 h. The expression of FOXM1 (A), cell division cycle 25A (CDC25A) (B), cell division cycle 25B (CDC25B) (C), cyclin B1 (CCNB1) (D), centromere protein A (CENPA) (E), polo like kinase 1 (PLK1) (F) and cyclin dependent kinase inhibitor 1A (CDKN1A/p21) (G) was assessed by real-time PCR. The expression level of each gene was normalized to the expression levels of the housekeeping genes glyceraldehyde-3-phosphate dehydrogenase (GAPDH) and TATA box binding protein (TBP). The results are expressed as the percentage of relative expression of transcripts obtained in E2-treated cells and are the means ± SEM of six independent experiments. * indicates a p-value < 0.05, ** indicates a p-value < 0.01 and *** indicates a p-value < 0.001 by one-way ANOVA followed by Dunnett’s post hoc test for comparison of the control treatment with the other treatments.
Figure 8
Figure 8
Validation of metabolism and growth arrest genes linked to HIF1α and EPAS1/HIF2α.MCF-7 cells were treated with solvent (white) as a negative control, 10−9 M E2 (blue) as a positive control, 10−8 M zearalenone (red) or 10−5 M apigenin (green) for 24 h. The expression of EPAS1/HIF2α (A), DNA damage inducible transcript 4 (DDIT4) (B), vascular endothelial growth factor A (VEGFA) (C) and lactate dehydrogenase A (LDHA) (D) was assessed by real-time PCR. The expression level of each gene was normalized to the expression levels of the housekeeping genes GAPDH and TBP. The results are expressed as the percentage of the relative expression of transcripts obtained in E2-treated cells and are the means ± SEM of six independent experiments. * indicates a p-value < 0.05 and *** indicates a p-value < 0.001 by one-way ANOVA followed by Dunnett’s post hoc test for comparison of the control treatment with the other treatments.
Figure 9
Figure 9
Validation of genes linked to cancer, nucleoli and apoptosis. MCF-7 cells were treated with solvent (white) as a negative control, 10−9 M E2 (blue) as a positive control, 10−8 M zearalenone (red) or 10−5 M apigenin (green) for 24 h. The expression of ADAM metallopeptidase with thrombospondin type 1 motif 4 (ADAMTS4) (A), CAMP-dependent protein kinase inhibitor beta (PKIB) (B), peripheral myelin protein 22 (PMP22) (C), inhibitor of differentiation 1 (ID1) (D), RNA binding motif 24 (RBM24) (E), apoptosis-enhancing nuclease (AEN) (F), nucleolar and coiled-body phosphoprotein 1 (NOLC1) (G) and block of proliferation 1 (BOP1) (H) was assessed by real-time PCR. The expression level of each gene was normalized to the expression levels of the housekeeping genes GAPDH and TBP. The results are expressed as the percentage of the relative expression of transcripts obtained in E2-treated cells and are the means ± SEM of six independent experiments. * indicates a p-value < 0.05, ** indicates a p-value < 0.01 and *** indicates a p-value < 0.001 by one-way ANOVA followed by Dunnett’s post hoc test for comparison of the control treatment with the other treatments.

References

    1. Rudel R.A., Attfield K.R., Schifano J.N., Brody J.G. Chemicals causing mammary gland tumors in animals signal new directions for epidemiology, chemicals testing, and risk assessment for breast cancer prevention. Cancer. 2007;109:2635–2666. doi: 10.1002/cncr.22653. - DOI - PubMed
    1. Crain D.A., Janssen S.J., Edwards T.M., Heindel J., Ho S., Hunt P., Iguchi T., Juul A., McLachlan J.A., Schwartz J., et al. Female reproductive disorders: The roles of endocrine-disrupting compounds and developmental timing. Fertil. Steril. 2008;90:911–940. doi: 10.1016/j.fertnstert.2008.08.067. - DOI - PMC - PubMed
    1. Wu A.H., Yu M.C., Tseng C.-C., Pike M.C. Epidemiology of soy exposures and breast cancer risk. Br. J. Cancer. 2008;98:9–14. doi: 10.1038/sj.bjc.6604145. - DOI - PMC - PubMed
    1. Caan B.J., Natarajan L., Parker B., Gold E.B., Thomson C., Newman V., Rock C.L., Pu M., Al-Delaimy W., Pierce J.P. Soy food consumption and breast cancer prognosis. Cancer Epidemiol. Biomark. Prev. 2011;20:854–858. doi: 10.1158/1055-9965.EPI-10-1041. - DOI - PMC - PubMed
    1. Lecomte S., Lelong M., Bourgine G., Efstathiou T., Saligaut C., Pakdel F. Assessment of the potential activity of major dietary compounds as selective estrogen receptor modulators in two distinct cell models for proliferation and differentiation. Toxicol. Appl. Pharmacol. 2017;325:61–70. doi: 10.1016/j.taap.2017.04.005. - DOI - PubMed