

Secalonic Acid-F, a Novel Mycotoxin, Represses the Progression of Hepatocellular Carcinoma via MARCH1 Regulation of the PI3K/AKT/β-catenin Signaling Pathway
- PMID: 30678274
- PMCID: PMC6385111
- DOI: 10.3390/molecules24030393
Secalonic Acid-F, a Novel Mycotoxin, Represses the Progression of Hepatocellular Carcinoma via MARCH1 Regulation of the PI3K/AKT/β-catenin Signaling Pathway
Abstract
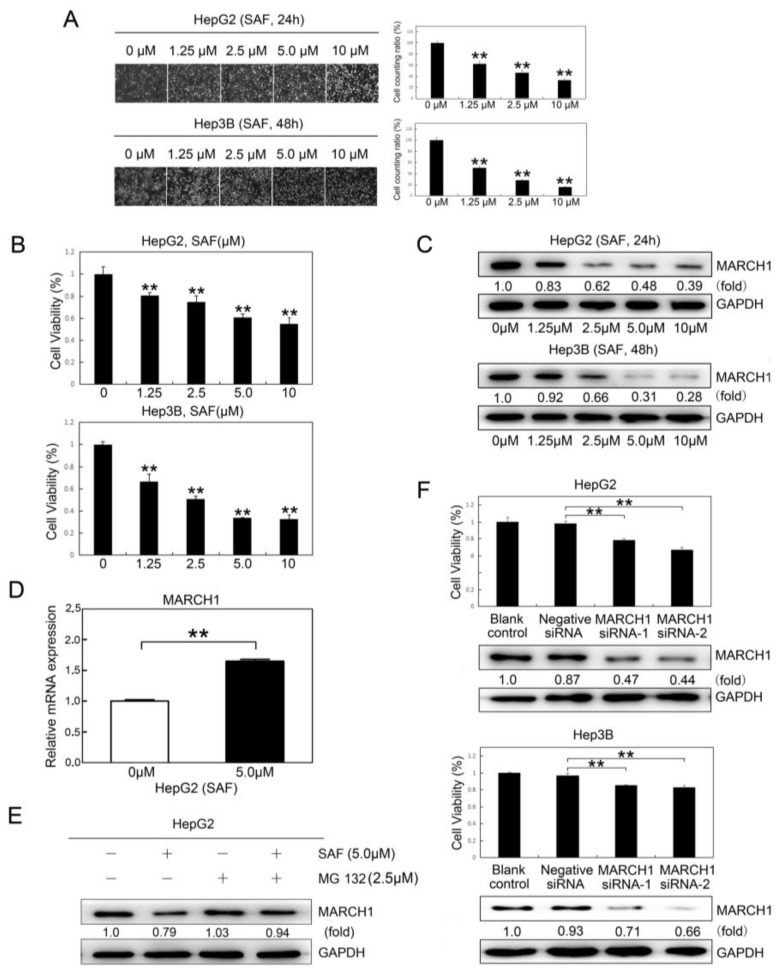
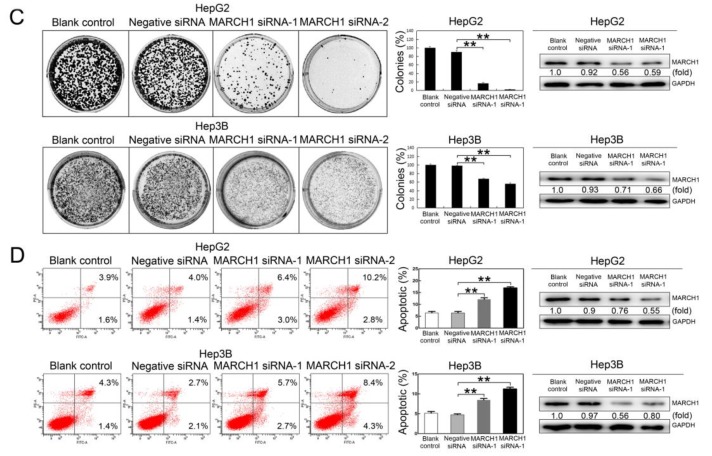
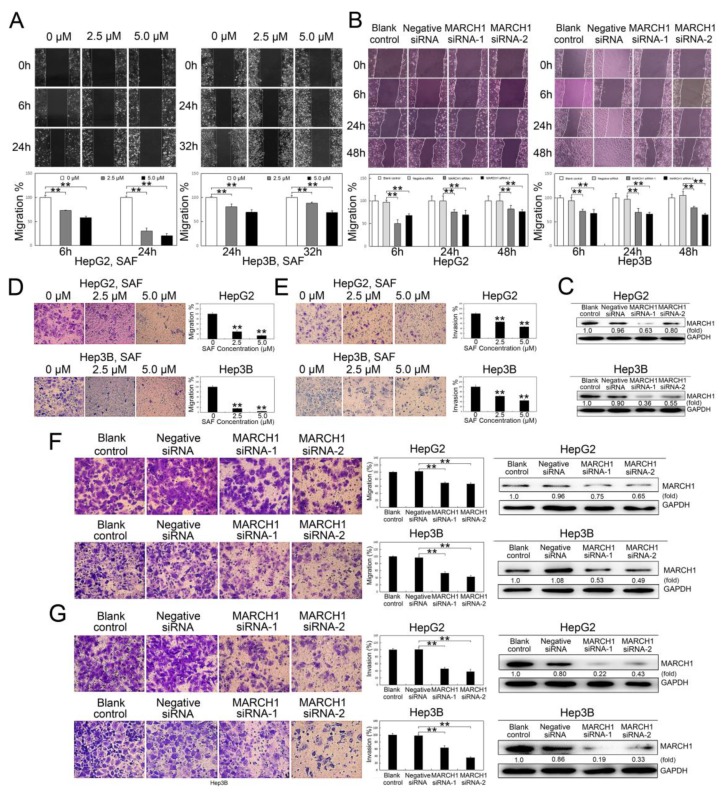
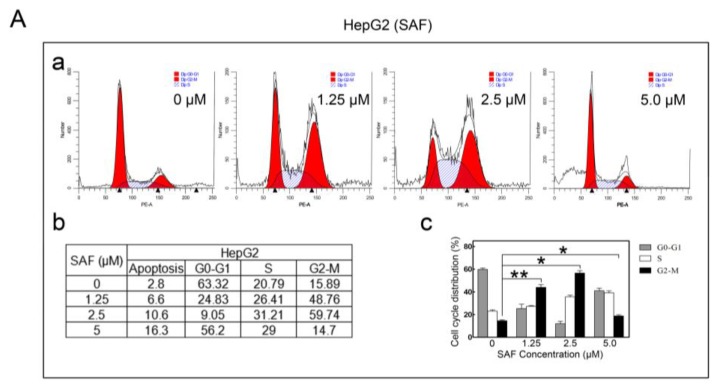
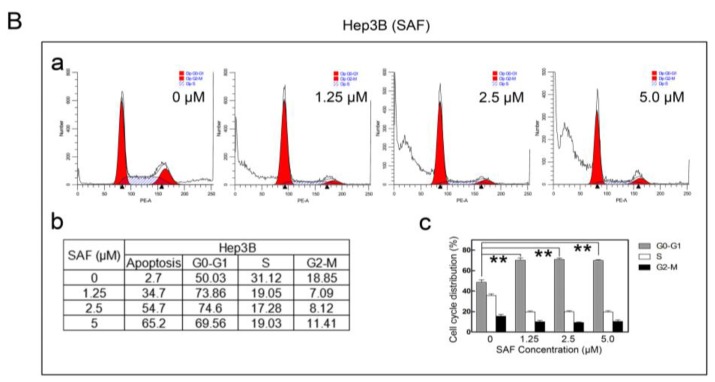
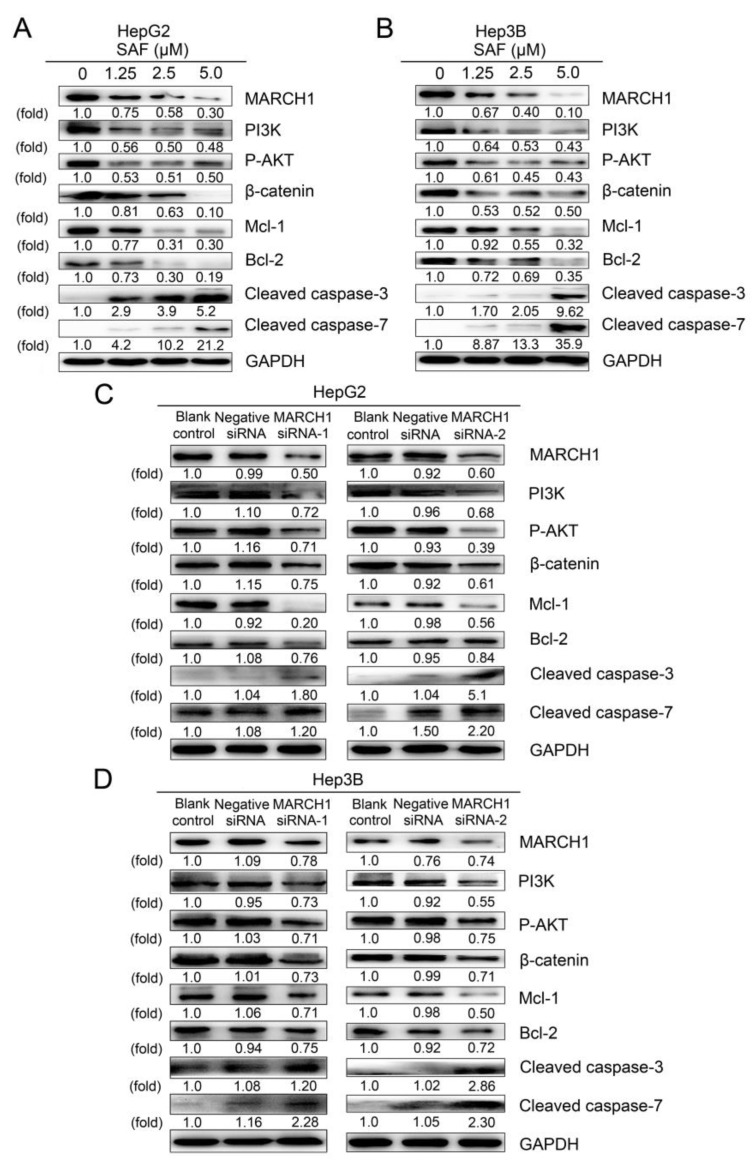
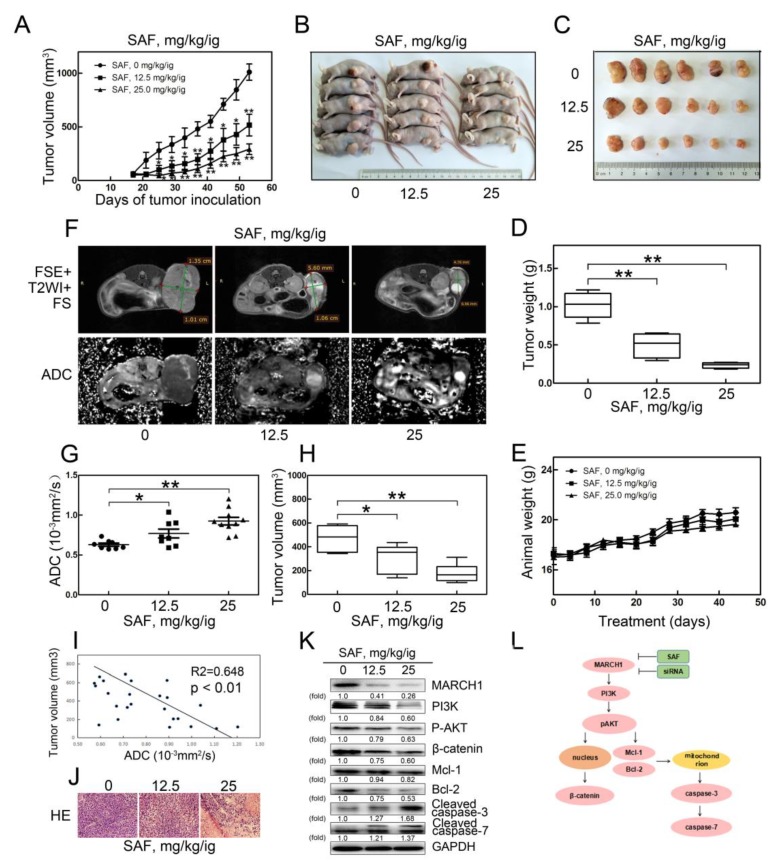
Liver cancer is a very common and significant health problem. Therefore, powerful molecular targeting agents are urgently needed. Previously, we demonstrated that secalonic acid-F (SAF) suppresses the growth of hepatocellular carcinoma (HCC) cells (HepG2), but the other anticancer biological functions and the underlying mechanism of SAF on HCC are unknown. In this study, we found that SAF, which was isolated from a fungal strain in our lab identified as Aspergillus aculeatus, could inhibit the progression of hepatocellular carcinoma by targeting MARCH1, which regulates the PI3K/AKT/β-catenin and antiapoptotic Mcl-1/Bcl-2 signaling cascades. First, we confirmed that SAF reduced the proliferation and colony formation of HCC cell lines (HepG2 and Hep3B), promoted cell apoptosis, and inhibited the cell cycle in HepG2 and Hep3B cells in a dose-dependent manner. In addition, the migration and invasion of HepG2 and Hep3B cells treated with SAF were significantly suppressed. Western blot analysis showed that the level of MARCH1 was downregulated by pretreatment with SAF through the regulation of the PI3K/AKT/β-catenin signaling pathways. Moreover, knockdown of MARCH1 by small interfering RNAs (siRNAs) targeting MARCH1 also suppressed the proliferation, colony formation, migration, and invasion as well as increased the apoptotic rate of HepG2 and Hep3B cells. These data confirmed that the downregulation of MARCH1 could inhibit the progression of hepatocellular carcinoma and that the mechanism may be via PI3K/AKT/β-catenin inactivation as well as the downregulation of the antiapoptotic Mcl-1/Bcl-2. In vivo, the downregulation of MARCH1 by treatment with SAF markedly inhibited tumor growth, suggesting that SAF partly blocks MARCH1 and further regulates the PI3K/AKT/β-catenin and antiapoptosis Mcl-1/Bcl-2 signaling cascade in the HCC nude mouse model. Additionally, the apparent diffusion coefficient (ADC) values, derived from magnetic resonance imaging (MRI), were increased in tumors after SAF treatment in a mouse model. Taken together, our findings suggest that MARCH1 is a potential molecular target for HCC treatment and that SAF is a promising agent targeting MARCH1 to treat liver cancer patients.
Keywords: MARCH1; PI3K/AKT/β-catenin; hepatocellular carcinoma; magnetic resonance imaging; proliferation; secalonic acid-F.
Conflict of interest statement
The authors declare they have no conflicts of interest.
Figures

Similar articles
-
MARCH1 encourages tumour progression of hepatocellular carcinoma via regulation of PI3K-AKT-β-catenin pathways.J Cell Mol Med. 2019 May;23(5):3386-3401. doi: 10.1111/jcmm.14235. Epub 2019 Feb 22. J Cell Mol Med. 2019. PMID: 30793486 Free PMC article.
-
Resveratrol inhibits the malignant progression of hepatocellular carcinoma via MARCH1-induced regulation of PTEN/AKT signaling.Aging (Albany NY). 2020 Jun 12;12(12):11717-11731. doi: 10.18632/aging.103338. Epub 2020 Jun 12. Aging (Albany NY). 2020. PMID: 32530437 Free PMC article.
-
Ropivacaine suppresses tumor biological characteristics of human hepatocellular carcinoma via inhibiting IGF-1R/PI3K/AKT/mTOR signaling axis.Bioengineered. 2021 Dec;12(2):9162-9173. doi: 10.1080/21655979.2021.1995103. Bioengineered. 2021. PMID: 34696683 Free PMC article.
-
Biological impact and therapeutic perspective of targeting PI3K/Akt signaling in hepatocellular carcinoma: Promises and Challenges.Pharmacol Res. 2023 Jan;187:106553. doi: 10.1016/j.phrs.2022.106553. Epub 2022 Nov 15. Pharmacol Res. 2023. PMID: 36400343 Review.
-
Role of regulatory miRNAs of the PI3K/AKT/mTOR signaling in the pathogenesis of hepatocellular carcinoma.J Cell Physiol. 2020 May;235(5):4146-4152. doi: 10.1002/jcp.29333. Epub 2019 Oct 29. J Cell Physiol. 2020. PMID: 31663122 Review.
Cited by
-
Wnt/β-Catenin Signaling as a Driver of Hepatocellular Carcinoma Progression: An Emphasis on Molecular Pathways.J Hepatocell Carcinoma. 2021 Nov 25;8:1415-1444. doi: 10.2147/JHC.S336858. eCollection 2021. J Hepatocell Carcinoma. 2021. PMID: 34858888 Free PMC article. Review.
-
Erianin suppresses hepatocellular carcinoma cells through down-regulation of PI3K/AKT, p38 and ERK MAPK signaling pathways.Biosci Rep. 2020 Jul 31;40(7):BSR20193137. doi: 10.1042/BSR20193137. Biosci Rep. 2020. PMID: 32677672 Free PMC article.
-
Targeting Mechanisms of the DNA Damage Response (DDR) and DNA Repair by Natural Compounds to Improve cAT-Triggered Tumor Cell Death.Molecules. 2022 Jun 1;27(11):3567. doi: 10.3390/molecules27113567. Molecules. 2022. PMID: 35684504 Free PMC article.
-
Genome-Wide Detection of Key Genes and Epigenetic Markers for Chicken Fatty Liver.Int J Mol Sci. 2020 Mar 5;21(5):1800. doi: 10.3390/ijms21051800. Int J Mol Sci. 2020. PMID: 32151087 Free PMC article.
-
Chemometric and Transcriptomic Profiling, Microtubule Disruption and Cell Death Induction by Secalonic Acid in Tumor Cells.Molecules. 2020 Jul 15;25(14):3224. doi: 10.3390/molecules25143224. Molecules. 2020. PMID: 32679716 Free PMC article.
References
-
- Villanueva A., Hoshida Y., Battiston C., Tovar V., Sia D., Alsinet C., Cornella H., Liberzon A., Kobayashi M., Kumada H. Combining clinical, pathology, and gene expression data to predict recurrence of hepatocellular carcinoma. Gastroenterology. 2011;140:1501–1512. doi: 10.1053/j.gastro.2011.02.006. - DOI - PMC - PubMed
MeSH terms
Substances
Grants and funding
LinkOut - more resources
Full Text Sources
Medical
Miscellaneous
