. 2019 Jan 24;8(2):84.
doi: 10.3390/cells8020084.

Biochemical Differences in Cerebrospinal Fluid between Secondary Progressive and Relapsing⁻Remitting Multiple Sclerosis

Affiliations

Biochemical Differences in Cerebrospinal Fluid between Secondary Progressive and Relapsing⁻Remitting Multiple Sclerosis

Stephanie Herman et al. Cells. .

Abstract

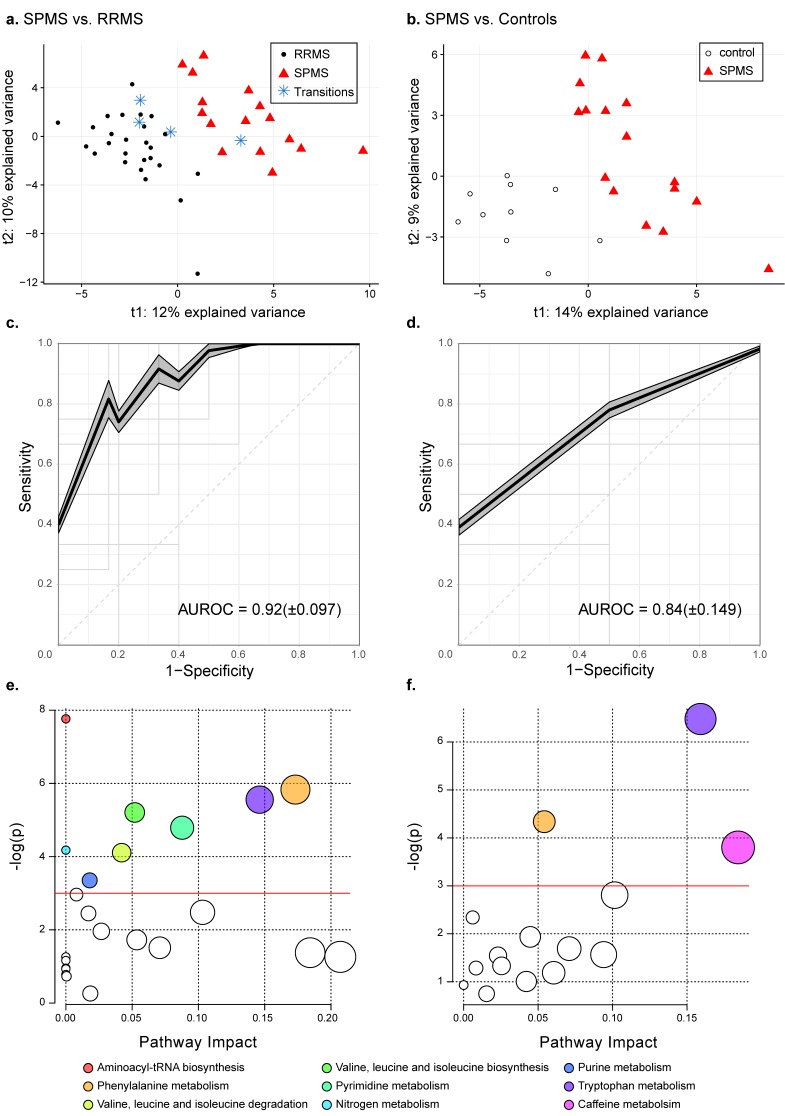
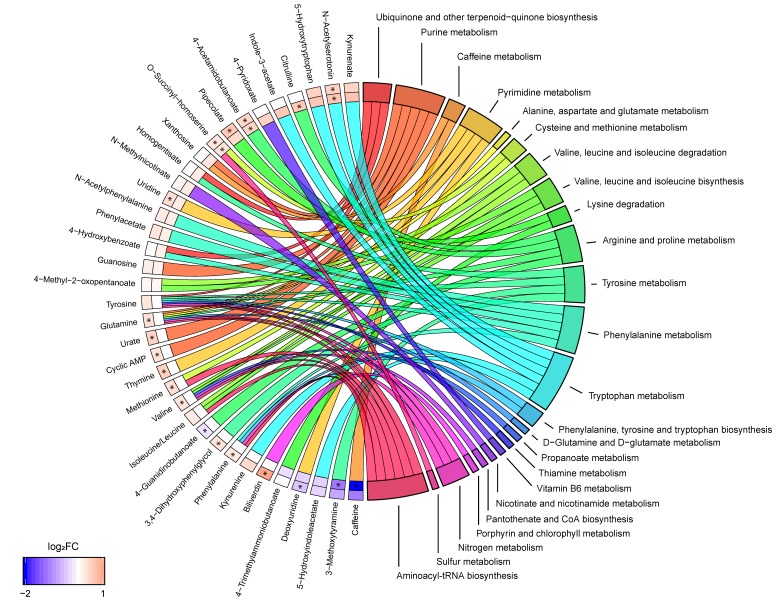
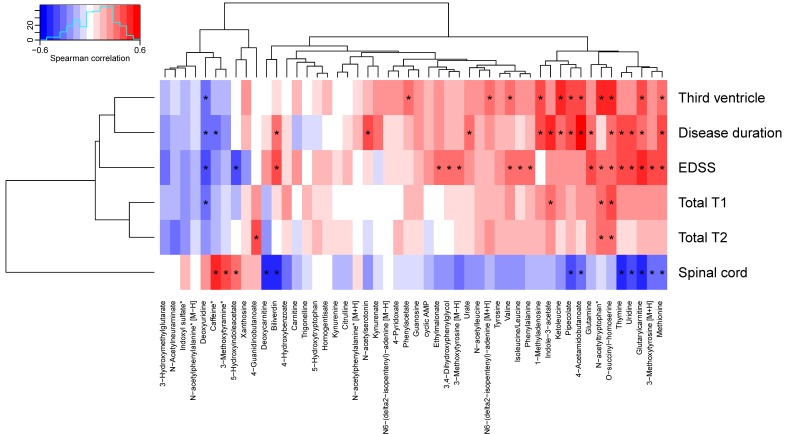
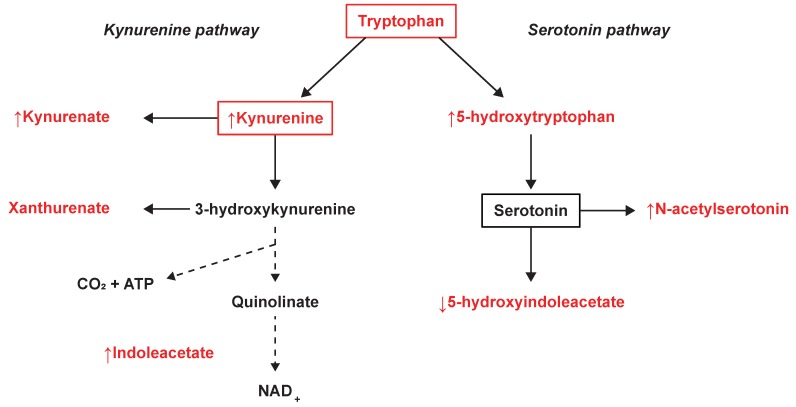
To better understand the pathophysiological differences between secondary progressive multiple sclerosis (SPMS) and relapsing-remitting multiple sclerosis (RRMS), and to identify potential biomarkers of disease progression, we applied high-resolution mass spectrometry (HRMS) to investigate the metabolome of cerebrospinal fluid (CSF). The biochemical differences were determined using partial least squares discriminant analysis (PLS-DA) and connected to biochemical pathways as well as associated to clinical and radiological measures. Tryptophan metabolism was significantly altered, with perturbed levels of kynurenate, 5-hydroxytryptophan, 5-hydroxyindoleacetate, and N-acetylserotonin in SPMS patients compared with RRMS and controls. SPMS patients had altered kynurenine compared with RRMS patients, and altered indole-3-acetate compared with controls. Regarding the pyrimidine metabolism, SPMS patients had altered levels of uridine and deoxyuridine compared with RRMS and controls, and altered thymine and glutamine compared with RRMS patients. Metabolites from the pyrimidine metabolism were significantly associated with disability, disease activity and brain atrophy, making them of particular interest for understanding the disease mechanisms and as markers of disease progression. Overall, these findings are of importance for the characterization of the molecular pathogenesis of SPMS and support the hypothesis that the CSF metabolome may be used to explore changes that occur in the transition between the RRMS and SPMS pathologies.

Keywords: cerebrospinal fluid; mass spectrometry; metabolomics; multiple sclerosis; pyrimidine; tryptophan.


Conflict of interest statement

The authors declare no conflict of interest.

Figures

Figure 1
Figure 1
Metabolic differences in SPMS compared with RRMS patients and controls. PLS-DA models comparing (a) SPMS vs. RRMS with quality metrics of R2 = 0.81: p < 0.05, Q2 = 0.47: p < 0.05 and (b) SPMS vs. controls with quality metrics of R2 = 0.85: p < 0.25, Q2 = 0.34: p < 0.05. The projected transitioning RRMS patients are represented by blue stars. Average ROC curves with corresponding average AUROC and standard deviation for the PLS-DA models comparing (c) SPMS with RRMS and (d) SPMS with controls. The shadowed areas indicate the standard error of the mean of the sensitivity and 1-specificity. (e) Pathway analyses on altered metabolites in SPMS compared with RRMS patients, and (f) SPMS patients compared with controls. The size of the node indicates the pathway impact (similar to the x-axis) computed by the relative betweenness centrality and the color corresponds to the pathway. Pathways that were found non-significant in both comparisons have been colored white. The red lines indicate the significance level of p = 0.05.
Figure 2
Figure 2
Metabolite to biochemical pathway linkages. The altered metabolites have been linked with pathways as color-coded ribbons. Blue-to-red coding next to the altered metabolites indicates the magnitude and direction of the log2 fold change (FC), where the inner layer represents FC in comparison with controls (SP-C) and the outer in comparison with RRMS (SP-RR). Significant FC with an FDR < 0.05 have been marked with a ‘*’.
Figure 3
Figure 3
Associations between altered metabolites and clinical data. Metabolite names marked with an asterisk have been corrected for age. Correlations marked with an asterisk are statistically significant (p < 0.05). EDSS: Expanded Disability Status Score.
Figure 4
Figure 4
Tryptophan metabolism and the observed changes in the kynurenine and serotonin pathways. The metabolites marked in red were identified and measured, where ↑ illustrates an averaged increase and ↓ an averaged decrease in SPMS patients.

References

    1. Dendrou C.A., Fugger L., Friese M.A. Immunopathology of Multiple Sclerosis. Nat. Rev. Immunol. 2015;15:545–558. doi: 10.1038/nri3871. - DOI - PubMed
    1. Wingerchuk D.M., Weinshenker B.G. Disease Modifying Therapies for Relapsing Multiple Sclerosis. BMJ. 2016;354:3518. doi: 10.1136/bmj.i3518. - DOI - PubMed
    1. Ontaneda D., Fox R.J., Chataway J. Clinical Trials in Progressive Multiple Sclerosis: Lessons Learned and Future Perspectives. Lancet Neurol. 2015;14:208–223. doi: 10.1016/S1474-4422(14)70264-9. - DOI - PMC - PubMed
    1. Mulero P., Midaglia L., Montalban X. Ocrelizumab: A New Milestone in Multiple Sclerosis Therapy. Ther. Adv. Neurol. Disord. 2018;11 doi: 10.1177/1756286418773025. - DOI - PMC - PubMed
    1. Bhargava P., Calabresi P.A. Metabolomics in Multiple Sclerosis. Mult. Scler. 2016;22:451–460. doi: 10.1177/1352458515622827. - DOI - PubMed

Publication types

LinkOut - more resources