. 2019 Jan 24;51(1):3.
doi: 10.1186/s12711-019-0446-x.

Multiple QTL underlie milk phenotypes at the CSF2RB locus

Affiliations

Multiple QTL underlie milk phenotypes at the CSF2RB locus

Thomas J Lopdell et al. Genet Sel Evol. .

Abstract

Background: Over many years, artificial selection has substantially improved milk production by cows. However, the genes that underlie milk production quantitative trait loci (QTL) remain relatively poorly characterised. Here, we investigate a previously reported QTL located at the CSF2RB locus on chromosome 5, for several milk production phenotypes, to better understand its underlying genetic and molecular causes.

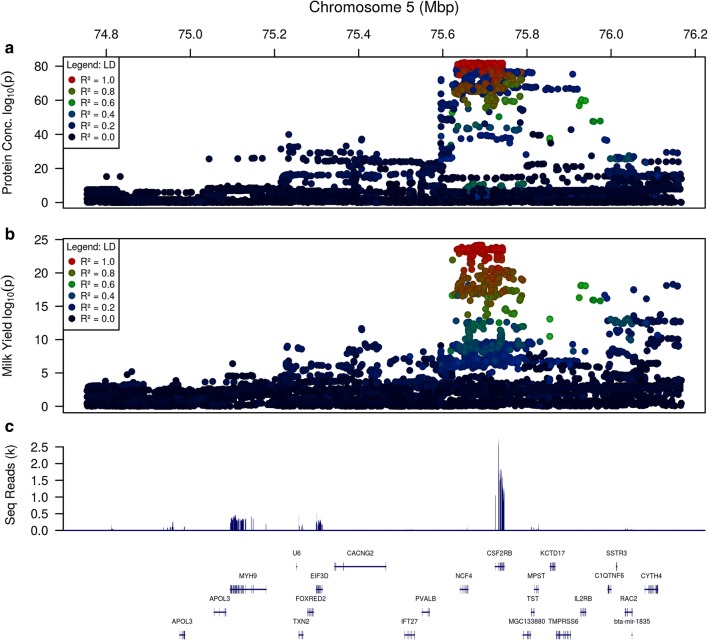
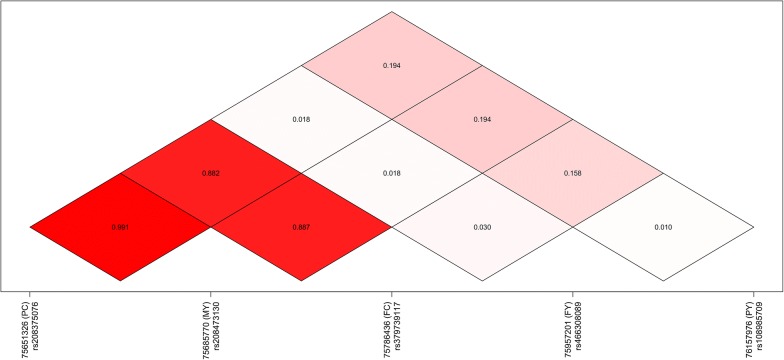
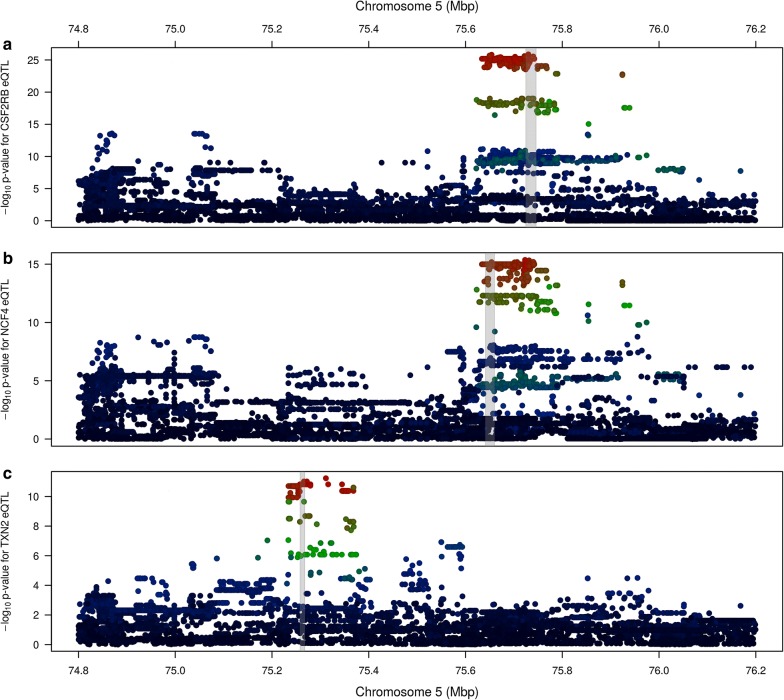
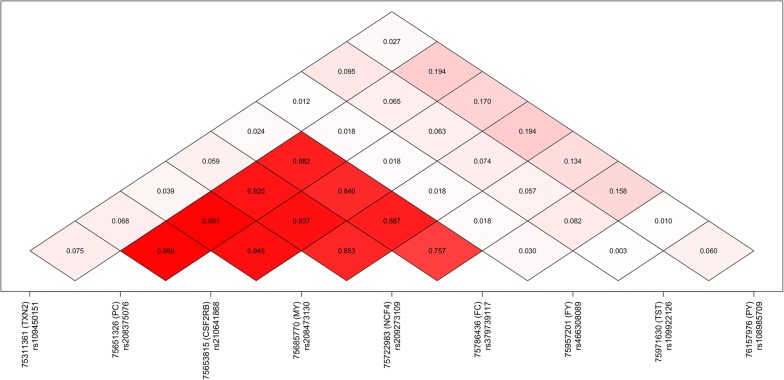
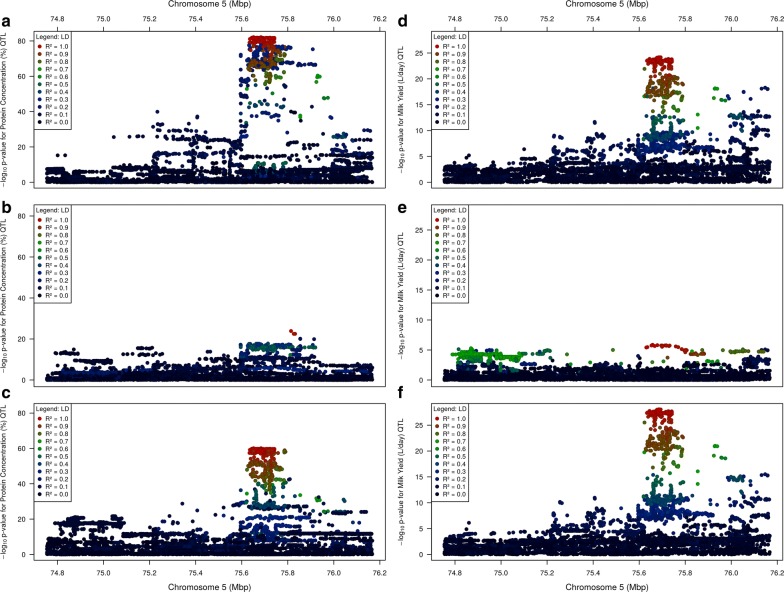
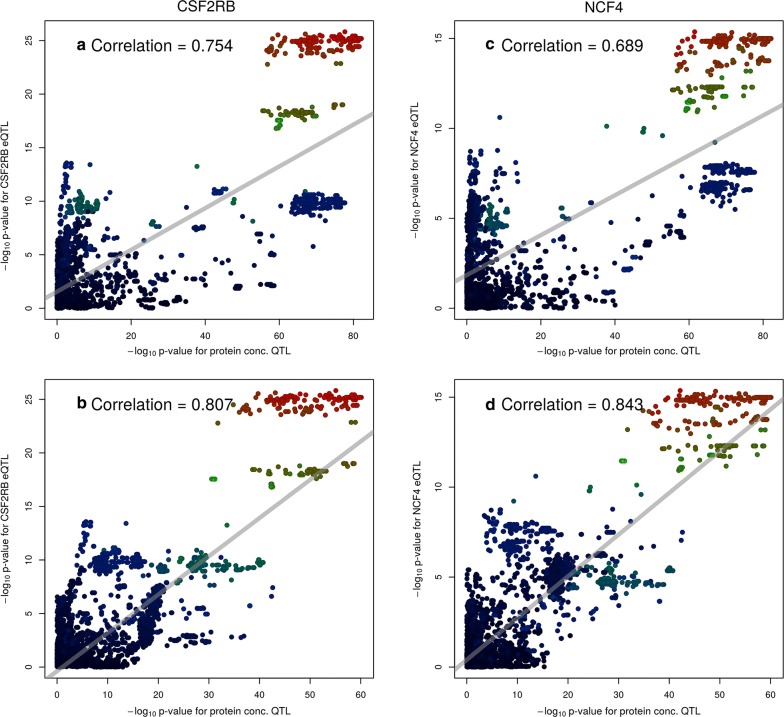
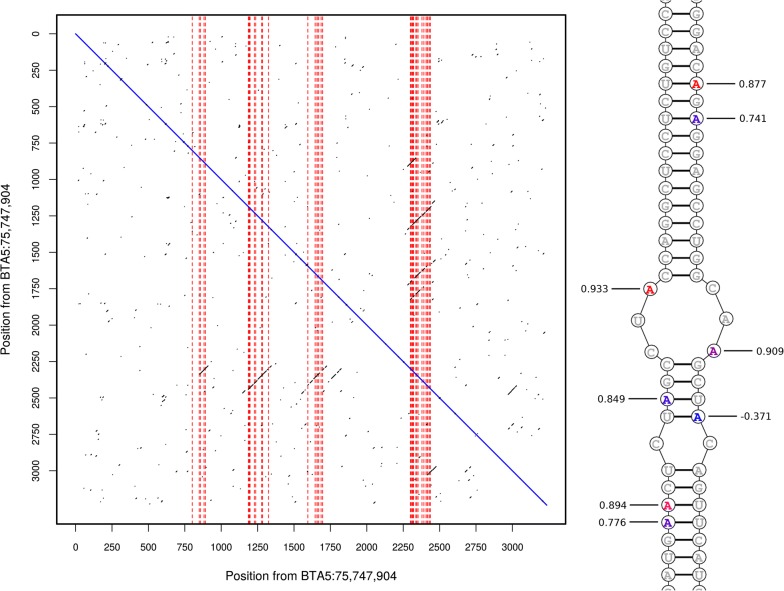
Results: Using a population of 29,350 taurine dairy cows, we conducted association analyses for milk yield and composition traits, and identified highly significant QTL for milk yield, milk fat concentration, and milk protein concentration. Strikingly, protein concentration and milk yield appear to show co-located yet genetically distinct QTL. To attempt to understand the molecular mechanisms that might be mediating these effects, gene expression data were used to investigate eQTL for 11 genes in the broader interval. This analysis highlighted genetic impacts on CSF2RB and NCF4 expression that share similar association signatures to those observed for lactation QTL, strongly implicating one or both of these genes as responsible for these effects. Using the same gene expression dataset representing 357 lactating cows, we also identified 38 novel RNA editing sites in the 3' UTR of CSF2RB transcripts. The extent to which two of these sites were edited also appears to be genetically co-regulated with lactation QTL, highlighting a further layer of regulatory complexity that involves the CSF2RB gene.

Conclusions: This locus presents a diversity of molecular and lactation QTL, likely representing multiple overlapping effects that, at a minimum, highlight the CSF2RB gene as having a causal role in these processes.


Figures

Fig. 1
Fig. 1
The genetic context of milk trait QTL. Panels a and b: QTL for the herd-test-derived phenotypes protein concentration (a) and milk yield (b). Colours represent LD (R2) with the most significant marker on a continuous scale, with colours provided in the legend for every 0.2 R2. Panel c shows the locations of genes mapping into this window (bottom) and the numbers of RNAseq reads mapping at positions across the window (top)
Fig. 2
Fig. 2
Linkage disequilibrium (LD) observed between the top associated markers for each phenotype (R2). Markers are identified using dbSNP reference SNP ID numbers. Phenotypes are as in Table 2
Fig. 3
Fig. 3
QTL plots showing eQTL for the three genes that exhibit genome-wide significant cis-eQTL (Table 3). From top to bottom, the three genes are a CSF2RB, b NCF4, and c TXN2. Colours represent correlations for each marker with the top variant for that eQTL (see Fig. 1 for legend). Grey bands indicate the location of the gene for which the eQTL is displayed
Fig. 4
Fig. 4
Linkage disequilibrium between the top tag variants for milk trait QTL and co-located gene expression QTL. Three genes with significant (P < 5×10⁻⁸) eQTL are included, along with the TST [2] that have previously been proposed as a candidate causative gene at this locus
Fig. 5
Fig. 5
The effect of fitting the top variant on protein concentration (ac) and milk yield (df) QTL. The top panels a and d show the QTL with no marker adjustments fitted; the centre panels b and e show the QTL after fitting the top variant from the panel above; and the bottom panels c and f show the QTL after fitting the top variant from the centre panel above. The phenotypes were adjusted by fitting the following markers: b rs208375076, c rs210293314, d rs208473130, e rs378861677
Fig. 6
Fig. 6
Correlations between eQTL and the co-located protein concentration QTL for the genes CSF2RB (left) and NCF4 (right). Panels on the top row are plotted against the original protein concentration QTL (Fig. 5a), while panels on the bottom row are plotted against the phenotype after fitting rs210293314 (Fig. 5c)
Fig. 7
Fig. 7
Left: dotplot of the sequence from the CSF2RB 3′-UTR against its complement. Positions are relative to chr5:75,747,904. Black dots indicate that seven of the 11 surrounding nucleotides are complementary. Vertical dashed red lines indicate the locations of predicted RNA-editing sites. Sections of the region 2275–2452 are complementary to the regions 837–915, 1178–1350, 1591–1719, and 1757–1832, suggesting that the UTR is able to fold into multiple configurations. Right: the section of predicted double stranded sequence between 1184 and 1217 on the left strand (running upward), and 2411–2444 on the right strand (running downward). Edited sites are coloured based on the strength of the edQTL at that site, from blue (not significant) to red (max P = 5.22 × 10−26). Sites are labelled with the correlation between the edQTL and the milk volume (MY) QTL after adjusting for marker rs208473130
Fig. 8
Fig. 8
a Histogram of copy number genotype calls of 560 animals from CNVnator. Copy numbers follow a trimodal distribution, suggesting that the variant is bialleleic. Genotype classes are coloured in gold (homozygous deletion), grey (heterozygous) and blue (homozygous wild-type). b Deletion variant genotypes plotted against the genotypes of the rs208086849 variant. The two variants are in strong LD (R2 = 0.887). Points are jittered to increase visibility

Similar articles

Cited by

References

    1. Raven LA, Cocks BG, Kemper KE, Chamberlain AJ, Vander Jagt CJ, Goddard ME, et al. Targeted imputation of sequence variants and gene expression profiling identifies twelve candidate genes associated with lactation volume, composition and calving interval in dairy cattle. Mamm Genome. 2016;27:81–97. doi: 10.1007/s00335-015-9613-8. - DOI - PubMed
    1. Pausch H, Emmerling R, Gredler-Grandl B, Fries R, Daetwyler HD, Goddard ME. Meta-analysis of sequence-based association studies across three cattle breeds reveals 25 QTL for fat and protein percentages in milk at nucleotide resolution. BMC Genomics. 2017;18:853. doi: 10.1186/s12864-017-4263-8. - DOI - PMC - PubMed
    1. Wang T, Chen YPP, MacLeod IM, Pryce JE, Goddard ME, Hayes BJ. Application of a Bayesian non-linear model hybrid scheme to sequence data for genomic prediction and QTL mapping. BMC Genomics. 2017;18:618. doi: 10.1186/s12864-017-4030-x. - DOI - PMC - PubMed
    1. Calus M, Goddard M, Wientjes Y, Bowman P, Hayes B. Multibreed genomic prediction using multitrait genomic residual maximum likelihood and multitask Bayesian variable selection. J Dairy Sci. 2018;101:4279–4294. doi: 10.3168/jds.2017-13366. - DOI - PubMed
    1. Grisart B, Coppieters W, Farnir F, Karim L, Ford C, Berzi P, et al. Positional candidate cloning of a QTL in dairy cattle: identification of a missense mutation in the bovine DGAT1 gene with major effect on milk yield and composition. Genome Res. 2002;12:222–231. doi: 10.1101/gr.224202. - DOI - PubMed

Substances