. 2019 Feb 20;101(4):648-661.e4.
doi: 10.1016/j.neuron.2018.12.026. Epub 2019 Jan 21.

Increased Excitation-Inhibition Ratio Stabilizes Synapse and Circuit Excitability in Four Autism Mouse Models

Affiliations

Increased Excitation-Inhibition Ratio Stabilizes Synapse and Circuit Excitability in Four Autism Mouse Models

Michelle W Antoine et al. Neuron. .

Abstract

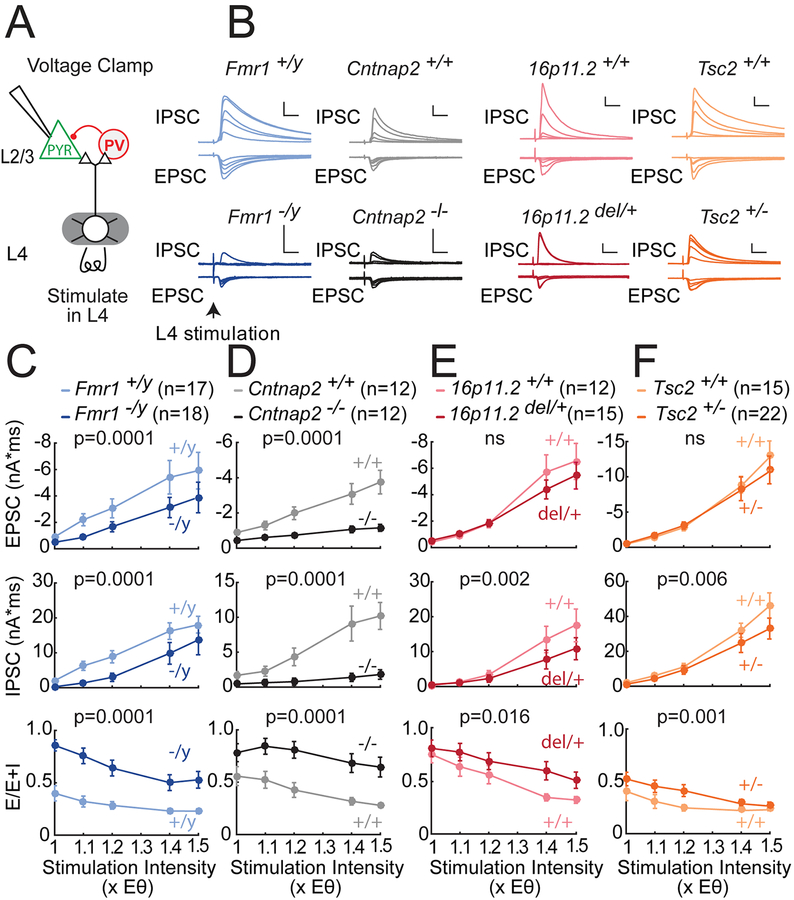
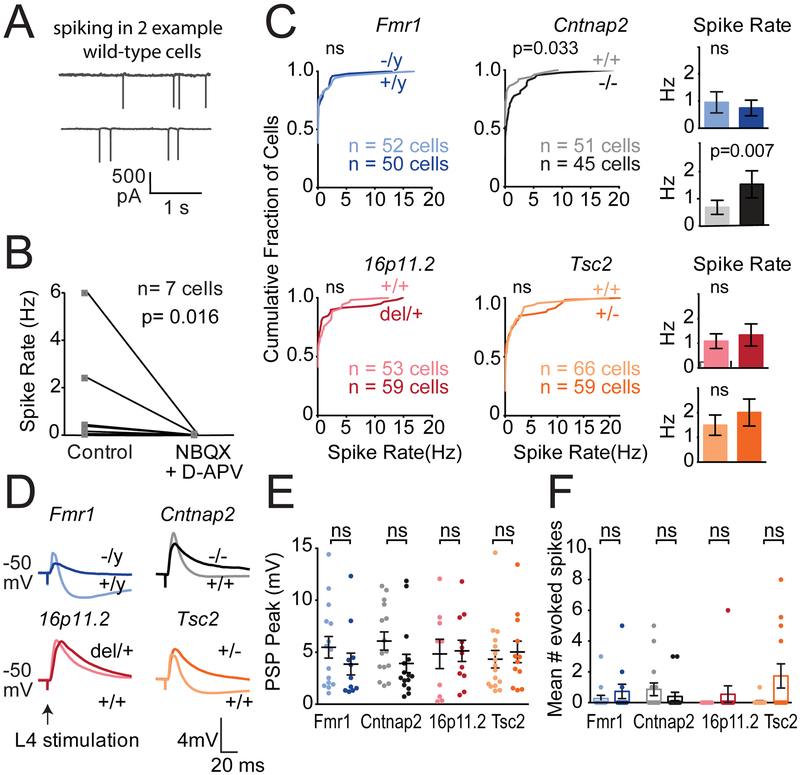
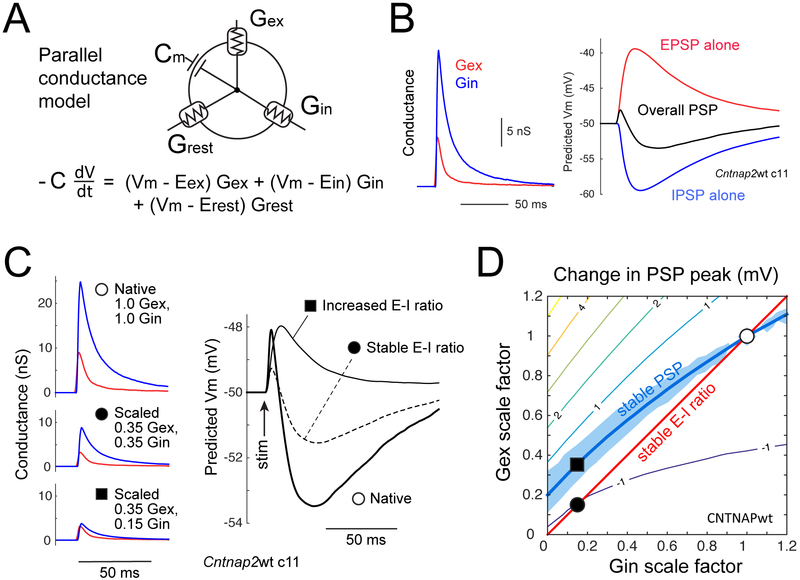
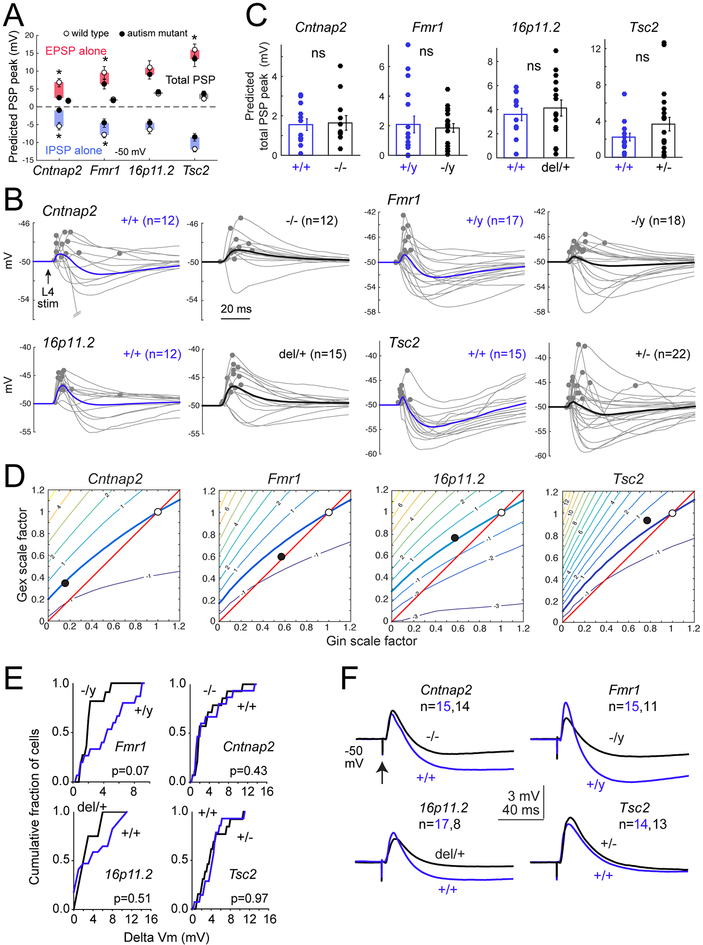
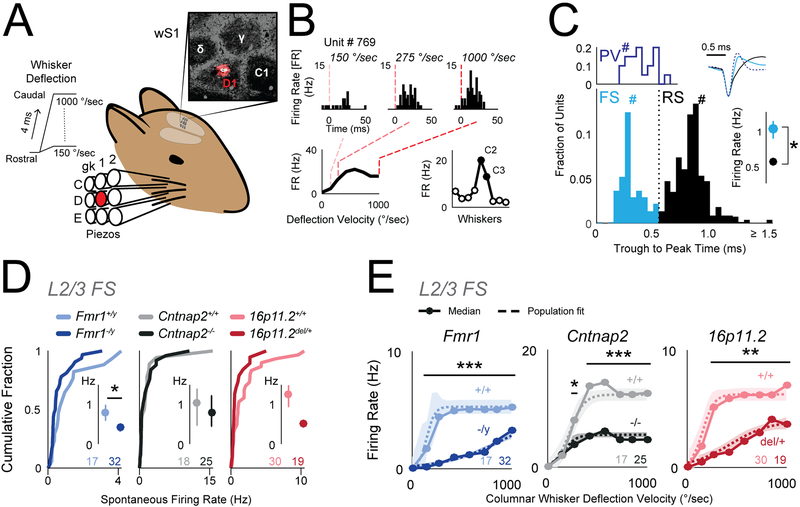
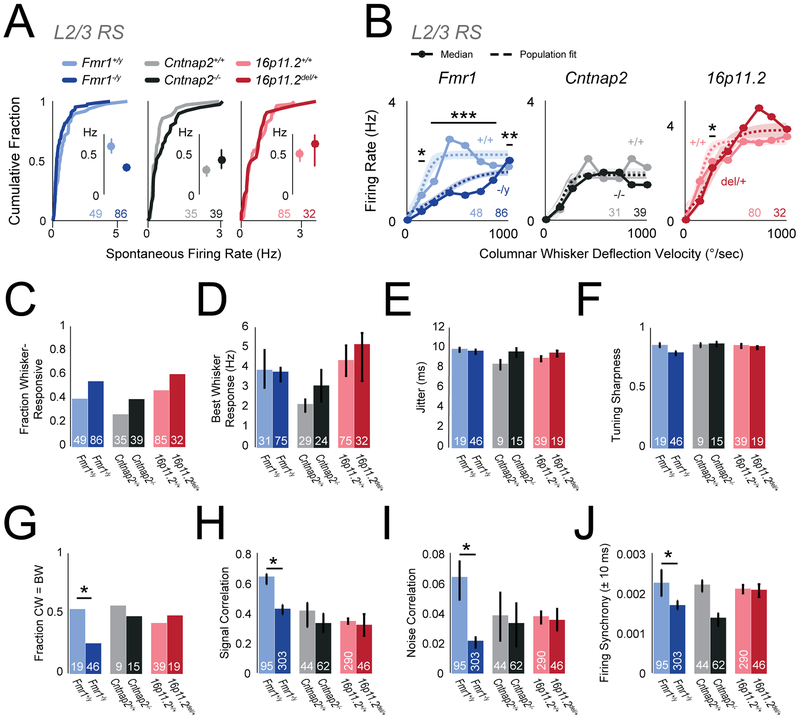
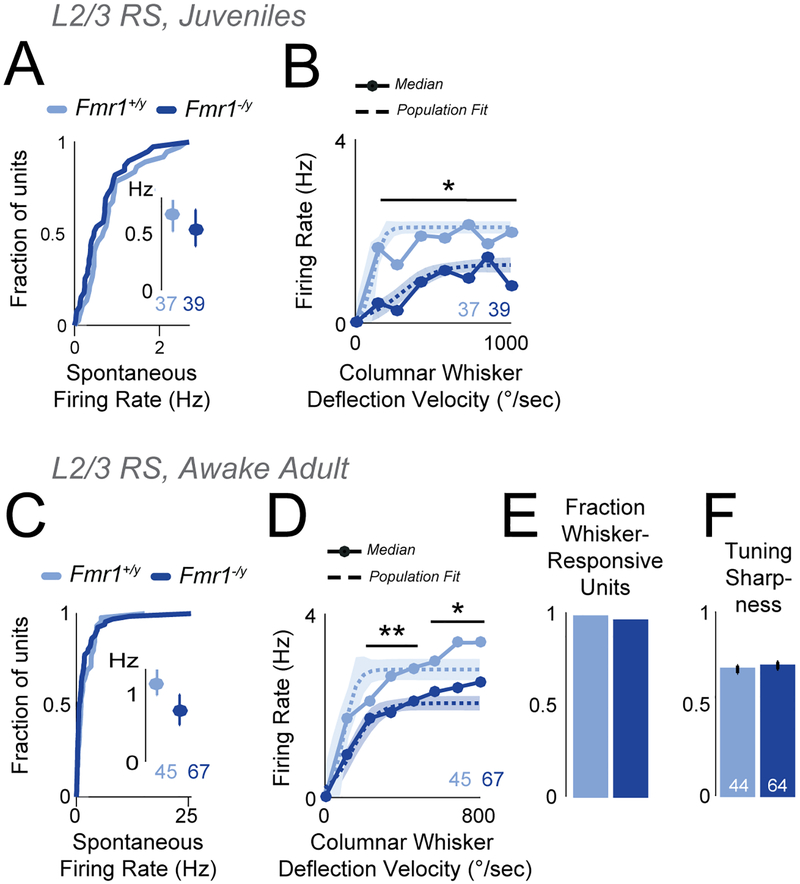
Distinct genetic forms of autism are hypothesized to share a common increase in excitation-inhibition (E-I) ratio in cerebral cortex, causing hyperexcitability and excess spiking. We provide a systematic test of this hypothesis across 4 mouse models (Fmr1-/y, Cntnap2-/-, 16p11.2del/+, Tsc2+/-), focusing on somatosensory cortex. All autism mutants showed reduced feedforward inhibition in layer 2/3 coupled with more modest, variable reduction in feedforward excitation, driving a common increase in E-I conductance ratio. Despite this, feedforward spiking, synaptic depolarization, and spontaneous spiking were largely normal. Modeling revealed that E and I conductance changes in each mutant were quantitatively matched to yield stable, not increased, synaptic depolarization for cells near spike threshold. Correspondingly, whisker-evoked spiking was not increased in vivo despite detectably reduced inhibition. Thus, elevated E-I ratio is a common circuit phenotype but appears to reflect homeostatic stabilization of synaptic drive rather than driving network hyperexcitability in autism.

Keywords: E-I ratio; Fragile X; autism; cerebral cortex; circuit excitability; excitation; homeostasis; inhibition; somatosensory cortex.


Conflict of interest statement

Declaration of Interests

The authors declare no competing interests.

Figures

Figure 1.
Figure 1.. Deficits in feedforward excitatory and inhibitory synaptic currents in L2/3 PYR cells in four ASD mouse lines.
(A) Experimental setup to measure L4-L2/3 feedforward EPSCs and IPSCs in S1 slices. (B) L4-evoked EPSCs and IPSCs at 1.0, 1.1, 1.2, 1.4 and 1.5x Eθ from 8 example L2/3 PYR cells from ASD mutant mice and corresponding wild types. Scale bars: 10 ms, 500 pA. (CF) Mean input-output curves for EPSCs, IPSCs, and E-I conductance ratio calculated as E/(E+I). Plots show mean ± SEM across cells. P-values are for genotype factor in a 2-way ANOVA on log-transformed data. N, number of cells.
Figure 2.
Figure 2.. Spiking of L2/3 PYR cells in S1 slices.
(A) Spontaneous spiking in active Ringer’s for two example L2/3 PYR cells in cell-attached mode. (B) Spontaneous spiking is abolished by glutamate blockers (n=7 L2/3 PYR cells in 4 C57BL/6 mice). P-value from Wilcoxon matched-pairs signed rank test. (C) Distribution of spontaneous firing rate in active slices in each genotype. Histograms show mean ± SEM of the same data. Differences were assessed by KS test. Histos have difft p-value, what test used? (D) L4-evoked PSPs recorded in L2/3 PYR cells at 1.4x Eθ from baseline Vm of −50 mV, with NMDA currents intact. One example cell from each genotype is shown. (E) L4-evoked PSP peak amplitude for all cells. Darker colors are ASD mutants. Each dot is one cell. Bars show mean ± SEM. 10–19 cells per genotype. (F) Mean number of L4-evoked spikes per sweep, per cell. Each dot is a cell. Bars show mean ± SEM. Significance in (E) and (F) was assessed by Mann-Whitney test, α= 0.05.
Figure 3.
Figure 3.. Relationship between E-I conductance ratio and PSP peak for cells near spike threshold
(A) Schematic of parallel conductance model. (B) Gex and Gin waveforms for an example wild type cell, and predicted EPSP (from Gex alone), IPSP (from Gin alone), and total PSP (from Gex and Gin together) at baseline Vm = −50 mV. (C) Conductance waveforms and predicted PSPs for one cell, for measured Gex and Gin waveforms at 1.4x Eθ (❍), after equal scaling to 0.35 of original (●), and further reduction in Gin to 0.15 of original that increases E-I conductance ratio (■). (D) Contour plot of mean predicted change in overall PSP peak for different combinations of Gex and Gin scaling, for all Cntnap2+/+ cells. Thick contour shows Gex/Gin combinations that predict no change in PSP peak (PSPdiff=0) from unscaled Gex/Gin. Blue region shows no significant change in PSP peak (p>0.05, bootstrap). Positive contour values denote increased predicted PSP peak. ❍ is average Gex and Gin in wild type cells. ● and ■ are from (C).
Figure 4.
Figure 4.. E-I conductance changes in ASD mutants predict stable PSPs
(A) Mean predicted EPSP, IPSP, and total PSP peak for each genotype at baseline Vm = −50 mV, for Gex and Gin recorded at 1.4x Eθ. Symbols are mean ± SEM across cells. N for each genotype is in (C). Stars, p<0.05, KS test. (B) PSP waveforms predicted from the measured Gex and Gin in each wild type and mutant cell. Dots show PSP peak. Bold, mean predicted PSP across cells. (C) Distribution of peak PSP for each genotype. Bars are mean ± SEM. ns, not significant by KS test. (D) Contour plots show PSP stability contour (thick curve) for all wild type cells of each genotype. ❍, average Gex and Gin of wild type cells [(1,1) by definition]. ●, average Gex and Gin measured in mutant cells, as fraction of wild type. In all mutants, this lies within 0.5 mV of the PSP stability contour. (E) Cumulative histograms of measured L4-evoked PSP peak across cells in each genotype from baseline Vm of −50 mV, at 1.4x Eθ, with APV in bath. There were no significant differences between any ASD mutant and its wild type. Statistics are by KS test, α=0.05. (F) Mean PSP waveforms for the experiment in (E).
Figure 5.
Figure 5.. Reduced columnar whisker-evoked firing of inhibitory FS units in L2/3 in vivo
(A) Schematic for in vivo recording experiments. Deflections were delivered to 9 whiskers centered on the whisker corresponding to the recorded column in S1. Inset, D1 recording site localized by DiI labeling in cytochrome oxidase stained section of L4. (B) Example L2/3 unit recorded in the C2 column showing responses to columnar whisker deflections at 3 velocities. Bottom, Velocity response curve (VRC; left) and whisker tuning curve (right) for this unit. Filled symbols, significant response. (C) Top left: Trough-to-peak times for optogenetically-tagged PV neurons in PV-Cre::ChR2 mice. Bottom: Trough-to-peak times for units from ASD mutant and wild type mice. Dotted line, FS-RS threshold. Hashes mark the example waveforms (upper right). Right: Bootstrapped median firing rate for FS and RS units. Error bars are 68% CI. n = FS: [285, 69] (units, mice), RS: [546,69]. * p<0.001, permutation test. (D) Spontaneous firing rate for L2/3 FS units, shown as cumulative distributions. Insets: Bootstrapped medians. Error bars are 68% CI. Numbers are units per genotype. * p=0.04, permutation test. (E) Velocity response curves for the L2/3 FS unit population, calculated after subtraction of spontaneous rate for each unit. Circles: Bootstrapped population median firing rate. Dashed curve is sigmoid fit to population data. Shaded region is 68% CI. Numbers are units per genotype. * p=0.03, ** p<<0.001, *** p<<0.0001, t-test.
Figure 6.
Figure 6.. Firing of excitatory L2/3 RS units in vivo is largely normal in autism mutants
(A) Spontaneous firing rate for L2/3 RS units, shown as cumulative distributions. Insets: Bootstrapped medians with 68% CI. In all panels, numbers are units per genotype. (B) Velocity response curves for the L2/3 RS unit population, calculated after subtraction of spontaneous rate for each unit. Circles: Bootstrapped population median. Dashed curve: sigmoid fit to population data. Shaded region is 68% CI. * p=0.01, ** p=0.001, *** p<<0.0001, t-test. (C) Fraction of units that are whisker-responsive in each genotype. (D) Magnitude of best whisker-evoked response (bootstrapped median with nonparametric 68% CI). (E) Mean spike jitter for whisker-evoked responses, for whisker-responsive units. Bars are SEM. (F) Tuning sharpness of whisker-responsive units. Bars, bootstrapped median. Error bars, 68% CI. (G) Fraction of whisker-responsive units whose best whisker (BW) is the columnar whisker (CW). * p=0.0243, χ2 test. (H) Signal correlation for pairs of L2/3 RS neurons. Bars, bootstrapped median. Error bars: 68% CI. * p<<0.0001, permutation test. N is cell pairs per genotype. (I) Noise correlation for pairs of L2/3 RS neurons. Bars, bootstrapped median. Error bars: 68% CI. * p=0.0005, permutation test. (J) Raw firing synchrony for pairs of L2/3 RS neurons, calculated as mean over ±10 ms in the cross-correlogram. Bars, bootstrapped median. Error bars: 68% CI. * p=0.00027, permutation test.
Figure 7.
Figure 7.. Firing of excitatory L2/3 RS units is reduced in anesthetized juvenile mice and awake adult Fmr1−/y mice.
(A) Spontaneous firing rate for L2/3 RS units in juvenile Fmr1−/y mice. Conventions as in Figure 6A. (B) Velocity response curves for juvenile Fmr1+/y and Fmr1−/y mice. Conventions as in Figure 6B. * p<<0.001, t-test. (C) Spontaneous firing rate of L2/3 RS units in awake, adult mice. Conventions as in (A). (D) Velocity response curves for the L2/3 RS unit population in awake, adult mice. Conventions as in (B). * p=0.003. ** p<0.003, t-test. (E) Fraction of L2/3 RS units that were whisker-responsive in awake, adult mice. (F) Tuning sharpness of whisker-responsive units.

Comment in

Similar articles

Cited by

References

    1. Arnett MT, Herman DH, and McGee AW (2014). Deficits in tactile learning in a mouse model of fragile X syndrome. PLoS ONE 9, e109116. - PMC - PubMed
    1. Banerjee A, Rikhye RV, Breton-Provencher V, Tang X, Li C, Li K, Runyan CA, Fu Z, Jaenisch R, and Sur M (2016). Jointly reduced inhibition and excitation underlies circuit-wide changes in cortical processing in Rett syndrome. Proc Natl Acad Sci U S A 113, E7287–E7296. - PMC - PubMed
    1. Bateup HS, Johnson CA, Denefrio CL, Saulnier JL, Kornacker K, and Sabatini BL (2013). Excitatory/inhibitory synaptic imbalance leads to hippocampal hyperexcitability in mouse models of tuberous sclerosis. Neuron 78, 510–522. - PMC - PubMed
    1. Berzhanskaya J, Phillips MA, Shen J, and Colonnese MT (2016). Sensory hypo-excitability in a rat model of fetal development in Fragile X Syndrome. Sci. Rep 6, 30769. - PMC - PubMed
    1. Chao H-T, Chen H, Samaco RC, Xue M, Chahrour M, Yoo J, Neul JL, Gong S, Lu H-C, Heintz N, et al. (2010). Dysfunction in GABA signalling mediates autism-like stereotypies and Rett syndrome phenotypes. Nature 468, 263–269. - PMC - PubMed

Publication types

MeSH terms