

Global, regional, and national burden of multiple sclerosis 1990-2016: a systematic analysis for the Global Burden of Disease Study 2016
- PMID: 30679040
- PMCID: PMC6372756
- DOI: 10.1016/S1474-4422(18)30443-5
Global, regional, and national burden of multiple sclerosis 1990-2016: a systematic analysis for the Global Burden of Disease Study 2016
Abstract
Background: Multiple sclerosis is the most common inflammatory neurological disease in young adults. The Global Burden of Diseases, Injuries, and Risk Factors Study (GBD) provides a systematic method of quantifying various effects of a given condition by demographic variables and geography. In this systematic analysis, we quantified the global burden of multiple sclerosis and its relationship with country development level.
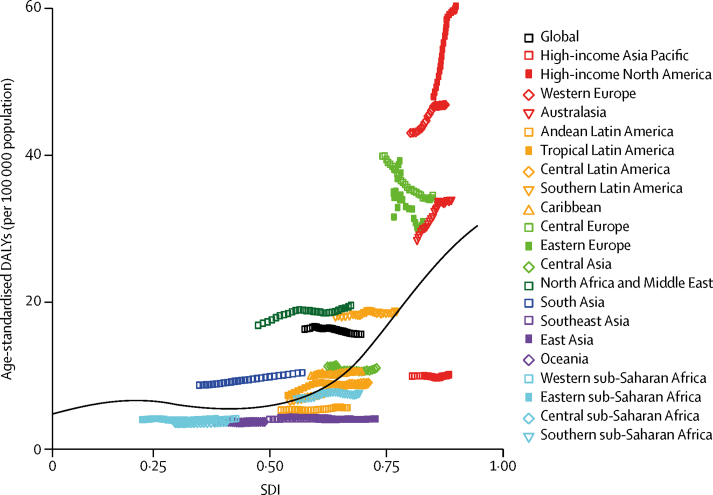
Methods: We assessed the epidemiology of multiple sclerosis from 1990 to 2016. Epidemiological outcomes for multiple sclerosis were modelled with DisMod-MR version 2.1, a Bayesian meta-regression framework widely used in GBD epidemiological modelling. Assessment of multiple sclerosis as the cause of death was based on 13 110 site-years of vital registration data analysed in the GBD's cause of death ensemble modelling module, which is designed to choose the optimum combination of mathematical models and predictive covariates based on out-of-sample predictive validity testing. Data on prevalence and deaths are summarised in the indicator, disability-adjusted life-years (DALYs), which was calculated as the sum of years of life lost (YLLs) and years of life lived with a disability. We used the Socio-demographic Index, a composite indicator of income per person, years of education, and fertility, to assess relations with development level.
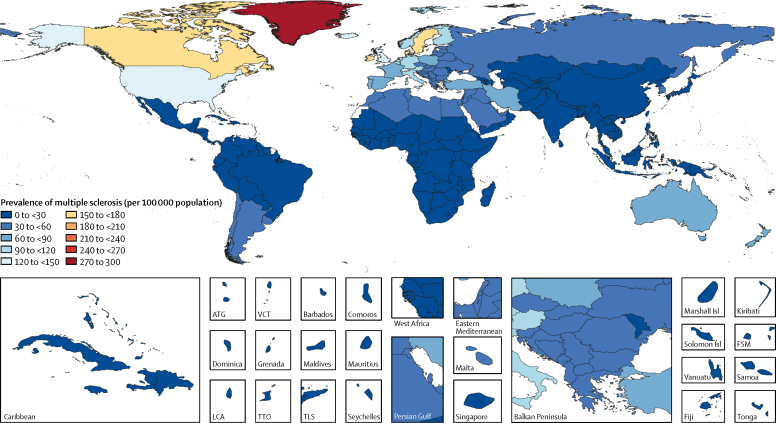
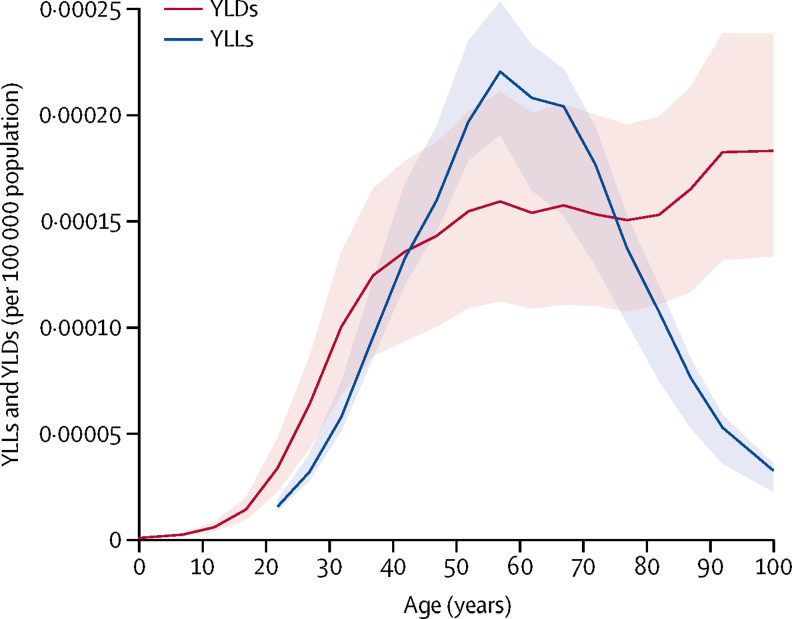
Findings: In 2016, there were 2 221 188 prevalent cases of multiple sclerosis (95% uncertainty interval [UI] 2 033 866-2 436 858) globally, which corresponded to a 10·4% (9·1 to 11·8) increase in the age-standardised prevalence since 1990. The highest age-standardised multiple sclerosis prevalence estimates per 100 000 population were in high-income North America (164·6, 95% UI, 153·2 to 177·1), western Europe (127·0, 115·4 to 139·6), and Australasia (91·1, 81·5 to 101·7), and the lowest were in eastern sub-Saharan Africa (3·3, 2·9-3·8), central sub-Saharan African (2·8, 2·4 to 3·1), and Oceania (2·0, 1·71 to 2·29). There were 18 932 deaths due to multiple sclerosis (95% UI 16 577 to 21 033) and 1 151 478 DALYs (968 605 to 1 345 776) due to multiple sclerosis in 2016. Globally, age-standardised death rates decreased significantly (change -11·5%, 95% UI -35·4 to -4·7), whereas the change in age-standardised DALYs was not significant (-4·2%, -16·4 to 0·8). YLLs due to premature death were greatest in the sixth decade of life (22·05, 95% UI 19·08 to 25·34). Changes in age-standardised DALYs assessed with the Socio-demographic Index between 1990 and 2016 were variable.
Interpretation: Multiple sclerosis is not common but is a potentially severe cause of neurological disability throughout adult life. Prevalence has increased substantially in many regions since 1990. These findings will be useful for resource allocation and planning in health services. Many regions worldwide have few or no epidemiological data on multiple sclerosis, and more studies are needed to make more accurate estimates.
Funding: Bill & Melinda Gates Foundation.
Copyright © 2019 The Author(s). Published by Elsevier Ltd. This is an Open Access article under the CC BY 4.0 license. Published by Elsevier Ltd.. All rights reserved.
Figures
Comment in
-
A global perspective on the burden of multiple sclerosis.Lancet Neurol. 2019 Mar;18(3):227-228. doi: 10.1016/S1474-4422(18)30498-8. Epub 2019 Jan 21. Lancet Neurol. 2019. PMID: 30679041 No abstract available.
References
-
- Belbasis L, Bellou V, Evangelou E. Environmental risk factors and multiple sclerosis, an umbrella review of systematic reviews and meta-analyses. Lancet Neurol. 2015;14:263–273. - PubMed
-
- Palace J, Duddy M, Bregenzer T. Effectiveness and cost-effectiveness of interferon beta and glatiramer acetate in the UK Multiple Sclerosis Risk Sharing Scheme at 6 years: a clinical cohort study with natural history comparator. Lancet Neurol. 2015;14:497–505. - PubMed
-
- Evans C, Beland SG, Kulaga S. Incidence and prevalence of multiple sclerosis in the Americas: a systematic review. Neuroepidemiol. 2013;40:195–210. - PubMed
Publication types
MeSH terms
LinkOut - more resources
Full Text Sources
Other Literature Sources
Medical
