

doi: 10.3174/ajnr.A5933.
Epub 2019 Jan 24.
Quantitative Susceptibility Mapping to Assess Cerebral Vascular Compliance
Affiliations
- PMID: 30679209
- PMCID: PMC6422309
- DOI: 10.3174/ajnr.A5933
Item in Clipboard
Quantitative Susceptibility Mapping to Assess Cerebral Vascular Compliance
AJNR Am J Neuroradiol.
2019 Mar.
Abstract
This study explored whether autoregulatory shifts in cerebral blood volume induce susceptibility changes large enough to be depicted by quantitative susceptibility mapping. Eight healthy subjects underwent fast quantitative susceptibility mapping at 3T while lying down to slowly decrease mean arterial pressure. A linear relationship between mean arterial pressure and susceptibility was observed in cortical and subcortical structures, likely representing vessels involved in autoregulation. The slope of this relationship is assumed to indicate the extent of cerebral vascular compliance.
© 2019 by American Journal of Neuroradiology.
Figures
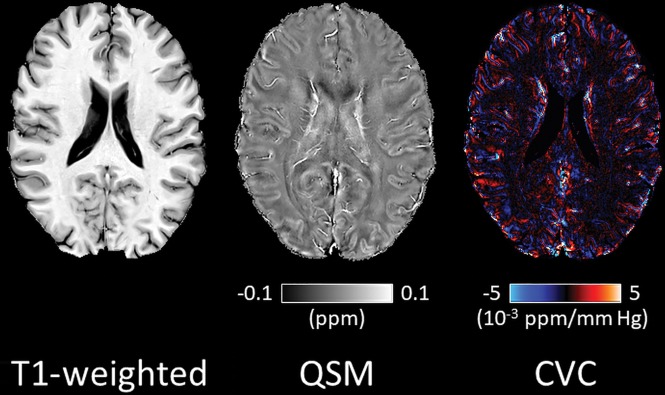
Representative T1-weighted image, quantitative susceptibility map, and the corresponding CVC map of an axial section from a single subject (from left to right). Additional axial sections of the same subject are shown in On-line Fig 4.
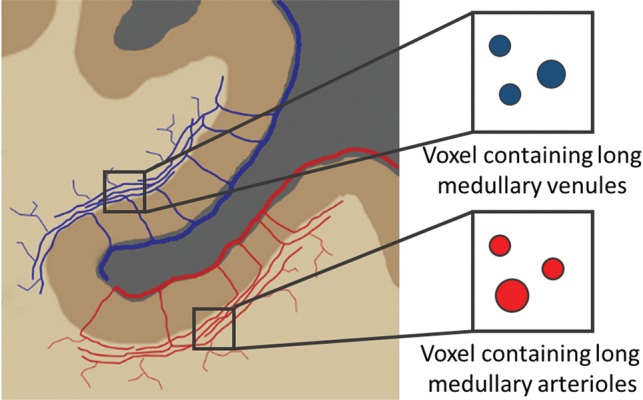
Schematic drawing of pial and subcortical blood vessels. The longest vessels with a high capability to modulate the diameter are the medullary arterioles and venules. According to Duvernoy type 5, these vessels follow the course of the subcortical interface over long distances before they branch into white matter.
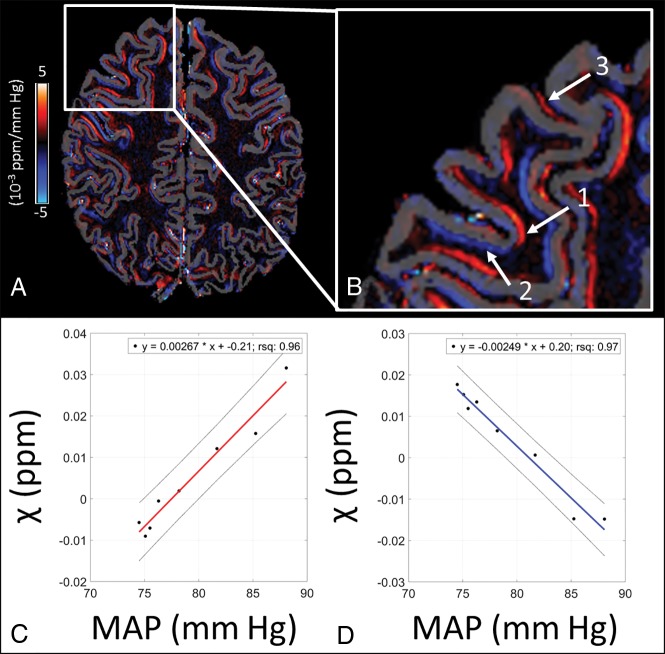
CVC map with a semicortical mask (A) and a zoomed inlay (B) showing regions with mainly arterial (arrow 1), venous (arrow 2), and pial arterial (arrow 3) contributions. In regions with predominantly arterial vessels (arrow 1), the susceptibility increases with increasing MAP (C), while it decreases in regions with predominantly venous vessels (arrow 2) with increasing MAP (D). The slope of the regression lines in C and D represents the CVC. rsq indicates the square of the correlation coefficient.
Similar articles
-
Oxygen extraction fraction mapping based combining quantitative susceptibility mapping and quantitative blood oxygenation level-dependent imaging model using multi-delay PCASL.Brain Res. 2025 Jan 1;1846:149259. doi: 10.1016/j.brainres.2024.149259. Epub 2024 Oct 3. Brain Res. 2025. PMID: 39368592
-
Impact of Head-Down Position on Cerebral Blood Flow in Healthy Subjects: An Arterial Spin-Labeling MR Perfusion Study.J Magn Reson Imaging. 2020 Jan;51(1):218-224. doi: 10.1002/jmri.26783. Epub 2019 May 9. J Magn Reson Imaging. 2020. PMID: 31074120
-
Quantitative susceptibility mapping as a measure of cerebral oxygenation in neonatal piglets.J Cereb Blood Flow Metab. 2022 May;42(5):891-900. doi: 10.1177/0271678X211065199. Epub 2021 Dec 8. J Cereb Blood Flow Metab. 2022. PMID: 34878947 Free PMC article.
-
Human cerebral circulation: positron emission tomography studies.Ann Nucl Med. 2005 Apr;19(2):65-74. doi: 10.1007/BF03027383. Ann Nucl Med. 2005. PMID: 15909484 Review.
-
Cerebral blood flow in ischemic vascular dementia and Alzheimer's disease, measured by arterial spin-labeling magnetic resonance imaging.Alzheimers Dement. 2009 Nov;5(6):454-62. doi: 10.1016/j.jalz.2009.04.1233. Alzheimers Dement. 2009. PMID: 19896584 Free PMC article.
Cited by
-
Dynamic fluctuations in brain iron content during migraine attacks: insights from relaxometry and diffusion tensor imaging.Front Neurol. 2024 Dec 20;15:1422313. doi: 10.3389/fneur.2024.1422313. eCollection 2024. Front Neurol. 2024. PMID: 39758781 Free PMC article.
-
Quantitative Susceptibility Mapping MRI in Deep-Brain Nuclei in First-Episode Psychosis.Schizophr Bull. 2023 Sep 7;49(5):1355-1363. doi: 10.1093/schbul/sbad041. Schizophr Bull. 2023. PMID: 37030007 Free PMC article.
-
Forging a path to mesoscopic imaging success with ultra-high field functional magnetic resonance imaging.Philos Trans R Soc Lond B Biol Sci. 2021 Jan 4;376(1815):20200040. doi: 10.1098/rstb.2020.0040. Epub 2020 Nov 16. Philos Trans R Soc Lond B Biol Sci. 2021. PMID: 33190599 Free PMC article. Review.
-
Pathophysiology, classification, and MRI parallels in microvascular disease of the heart and brain.Microcirculation. 2020 Nov;27(8):e12648. doi: 10.1111/micc.12648. Epub 2020 Jul 26. Microcirculation. 2020. PMID: 32640064 Free PMC article. Review.
-
Non-Invasive Evaluation of Cerebral Microvasculature Using Pre-Clinical MRI: Principles, Advantages and Limitations.Diagnostics (Basel). 2021 May 21;11(6):926. doi: 10.3390/diagnostics11060926. Diagnostics (Basel). 2021. PMID: 34064194 Free PMC article. Review.
References
Publication types
MeSH terms
Grants and funding
LinkOut - more resources
Full Text Sources