. 2019 Feb;29(2):304-316.
doi: 10.1101/gr.241455.118. Epub 2019 Jan 24.

Fast and flexible bacterial genomic epidemiology with PopPUNK

Affiliations

Fast and flexible bacterial genomic epidemiology with PopPUNK

John A Lees et al. Genome Res. 2019 Feb.

Abstract

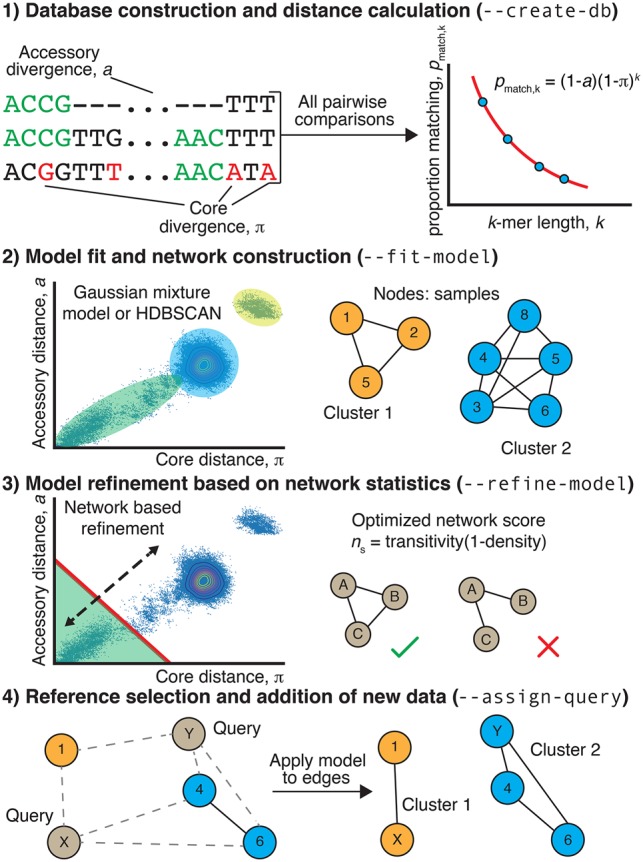
The routine use of genomics for disease surveillance provides the opportunity for high-resolution bacterial epidemiology. Current whole-genome clustering and multilocus typing approaches do not fully exploit core and accessory genomic variation, and they cannot both automatically identify, and subsequently expand, clusters of significantly similar isolates in large data sets spanning entire species. Here, we describe PopPUNK (Population Partitioning Using Nucleotide K -mers), a software implementing scalable and expandable annotation- and alignment-free methods for population analysis and clustering. Variable-length k-mer comparisons are used to distinguish isolates' divergence in shared sequence and gene content, which we demonstrate to be accurate over multiple orders of magnitude using data from both simulations and genomic collections representing 10 taxonomically widespread species. Connections between closely related isolates of the same strain are robustly identified, despite interspecies variation in the pairwise distance distributions that reflects species' diverse evolutionary patterns. PopPUNK can process 103-104 genomes in a single batch, with minimal memory use and runtimes up to 200-fold faster than existing model-based methods. Clusters of strains remain consistent as new batches of genomes are added, which is achieved without needing to reanalyze all genomes de novo. This facilitates real-time surveillance with consistent cluster naming between studies and allows for outbreak detection using hundreds of genomes in minutes. Interactive visualization and online publication is streamlined through the automatic output of results to multiple platforms. PopPUNK has been designed as a flexible platform that addresses important issues with currently used whole-genome clustering and typing methods, and has potential uses across bacterial genetics and public health research.


Figures

Figure 1.
Figure 1.
Summary of the PopPUNK algorithm. (Step 1) For each pairwise comparison of sequences, the proportion of shared k-mers of different lengths is used to calculate a core and accessory distance. Differences in gene content cause k-mers (examples highlighted in green) to mismatch irrespective of length, whereas point mutations distinguishing orthologous sequences cause longer k-mers to mismatch more frequently than shorter k-mers. (Step 2) The scatterplot of these core and accessory distances is clustered to identify the set of distances representing “within-strain” comparisons between closely related isolates. A network is then constructed from nodes, corresponding to isolates, linked by short genetic distances, corresponding to within-strain comparisons. Connected components of this network define clusters. (Step 3) The threshold defining within-strain links is then refined using a network score, ns, in order to generate a sparse but highly clustered network. (Step 4) Finally, the network is pruned by taking one sample from each clique. The distances between new query sequences and references are calculated, and within-strain distances used to add new edges. The clusters are then reevaluated as in Step 3, with the nomenclature being kept consistent with the original reference cluster names.
Figure 2.
Figure 2.
Detection of genetic diversity in simulated populations by PopPUNK. Each plot shows the deviation in gene sequence (π) and gene content (a) estimated by PopPUNK from a sample of 25 isolates from each of 50 simulations run with the same parameters. (A,B) Deviation through point mutation only. As the rate of point mutation (base−1 generation−1) was increased over two orders of magnitude, estimates of population-wide π increased accordingly, as shown by the distribution of pairwise core distances in the top row of histograms (A). The scatterplots below (i.e., in B) show that a measurements remained below 5 × 10⁻³, demonstrating the specificity with which divergence was measured. (C) Deviation through insertions and deletions. To test the estimation of a in a clonally evolving population, simulations included insertions and deletions of 100-bp segments occurring at a rate defined relative to the fixed point mutation rate of 5 × 10⁻⁶ base−1 generation−1. Estimates of a increased proportionately with this rate, without affecting the observed range of π. (D) Effects of recombination on the distribution of genetic diversity. With the insertion and deletion rate fixed at 0.05 relative to the point mutation rate of 5 × 10⁻⁶ base−1 generation−1, the rate of recombination relative to point mutations was then varied. This resulted in a concentration of the estimated distances into a single mode, representing the changing population structure as frequent exchange between isolates homogenizes the divergence between them in both gene sequence and content.
Figure 3.
Figure 3.
Comparison of core and accessory distances from PopPUNK (x-axis) and pan-genome construction with Roary (y-axis). For each species, the core distance was calculated as the Tamura-Nei (tn93) distance from the core genome alignment; the accessory distance was calculated as the Jaccard distance between binary strings representing gene presence/absence. In each panel, the line of identity (red line) and a linear regression (blue line) are also plotted. Sketch sizes were 104, except for M. tuberculosis which used a sketch size of 105.
Figure 4.
Figure 4.
PopPUNK model fitting output for five archetypal examples (other species shown in Supplemental Fig. S8). Each row is a species, with each plot showing the distribution of core and accessory distances. In each plot, points are colored by their predicted cluster, and the cluster closest to the origin is the within-strain cluster. The two-dimensional Gaussian mixture model (2D GMM) is in the left column, which also shows ellipses with the mean and covariance of the fitted mixture components. The HDBSCAN plot in the center column shows unclassified noise points in black. The right column shows the fits when maximizing the network score to refine the 2D GMM fit. Listeria monocytogenes has clearly separated clusters, which were well-predicted by all methods. Although there is more complex structure on the plots, Escherichia coli and Neisseria meningitidis have a within-strain cluster also well captured by all approaches. In Streptococcus pneumoniae, recombination makes the boundary between clusters less distinct, and the mixture model includes too many links (Fig. 5A). HDBSCAN is more accurate, but the refinement of the initial fit provides the most accurate and intuitive demarcation of the within-strain links. Streptococcus pyogenes exhibits low within-strain recombination; hence, it has a dense cluster of points near the origin of the graph, but high between-strain divergence, resulting in the single, broad between-strain set of points. Network score fit refinement is required for an accurate model fit in this case.
Figure 5.
Figure 5.
Network and query assignment for S. pneumoniae and E. coli. (A) Cytoscape view of the network for the Massachusetts S. pneumoniae data set using the 2D GMM fit. Nodes (colored dots) are samples and edges (lines) are those pairwise distances classified as within-strain. The nodes are colored by clusters according to the refined fit in B, showing which clusters are incorrectly merged in the mixture model fit. (B) As in A, but showing the network after fit refinement. High-stress edges causing clusters to be merged have been removed after maximizing the network score. (C) Box plots showing the similarities between cluster assignment when running PopPUNK in different modes. The different model types (2D GMM or HDBSCAN) implemented in PopPUNK were each fitted to either the Massachusetts or Maela S. pneumoniae population defined in Corander et al. (2017), then refined. The three nonreference populations were then added in successive batches, either through comparisons to the full data set or a representative set of reference sequences selected based on network structure, in all possible permutations. The Rand index was used to quantify clustering similarity between all those permutations in which the final population to be integrated was the same; only those isolates in the most recent extension of the network were used. These values are shown separated according to the starting reference population (Massachusetts or Maela), initial model (2D GMM or HDBSCAN), and comparison method (bar color; full database or references only). (D,E) Simulating surveillance of the E. coli BSAC population. A five-component 2D GMM was fitted to the pairwise distances between the 2001 isolates, and batches of isolates from successive years added sequentially either retaining the full database throughout (D) or identifying references after each addition (E). The stacked bar charts show the prevalence of strains in the population in each year, with the black component representing isolates of the multidrug-resistance-associated ST131 lineage, which emerged from 2002 onward. The full output of this analysis is provided in Supplemental Table S3.

References

    1. Aanensen DM, Spratt BG. 2005. The multilocus sequence typing network: mlst.net. Nucleic Acids Res 33: W728–W733. 10.1093/nar/gki415 - DOI - PMC - PubMed
    1. Aanensen DM, Feil EJ, Holden MT, Dordel J, Yeats CA, Fedosejev A, Goater R, Castillo-Ramírez S, Corander J, Colijn C, et al. 2016. Whole-genome sequencing for routine pathogen surveillance in public health: a population snapshot of invasive Staphylococcus aureus in Europe. MBio 7: e00444-16 10.1128/mBio.00444-16 - DOI - PMC - PubMed
    1. Abudahab K, Prada JM, Yang Z, Bentley SD, Croucher NJ, Corander J, Aanensen DM. 2018. PANINI: pangenome neighbour identification for bacterial populations. Microb Genom 4: e000220 10.1099/mgen.0.000220 - DOI - PMC - PubMed
    1. Achtman M. 2012. Insights from genomic comparisons of genetically monomorphic bacterial pathogens. Philos Trans R Soc Lond B Biol Sci 367: 860–867. 10.1098/rstb.2011.0303 - DOI - PMC - PubMed
    1. Alikhan NF, Zhou Z, Sergeant MJ, Achtman M. 2018. A genomic overview of the population structure of Salmonella. PLoS Genet 14: e1007261 10.1371/journal.pgen.1007261 - DOI - PMC - PubMed

Publication types