. 2019 Jan 24;10(1):410.
doi: 10.1038/s41467-018-08262-y.

Contribution of rare and common variants to intellectual disability in a sub-isolate of Northern Finland

Affiliations

Contribution of rare and common variants to intellectual disability in a sub-isolate of Northern Finland

Mitja I Kurki et al. Nat Commun. .

Abstract

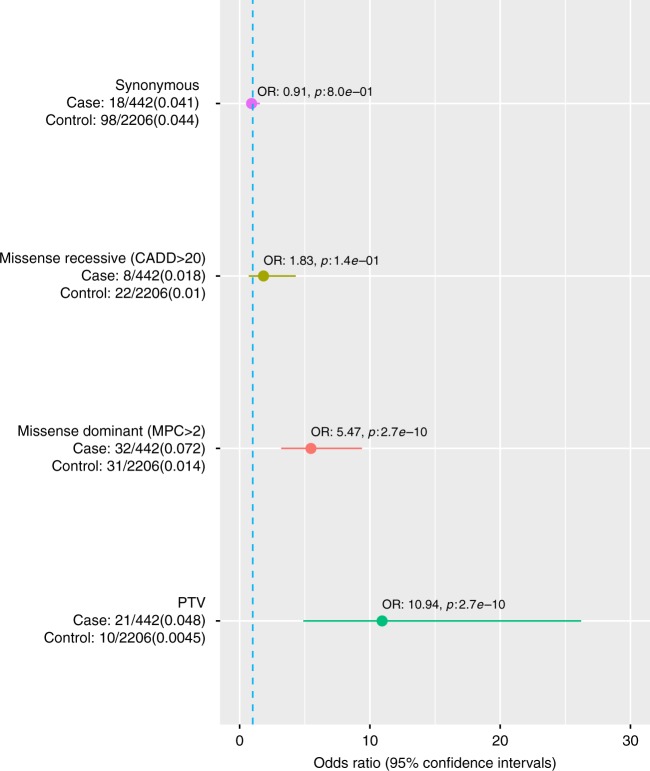
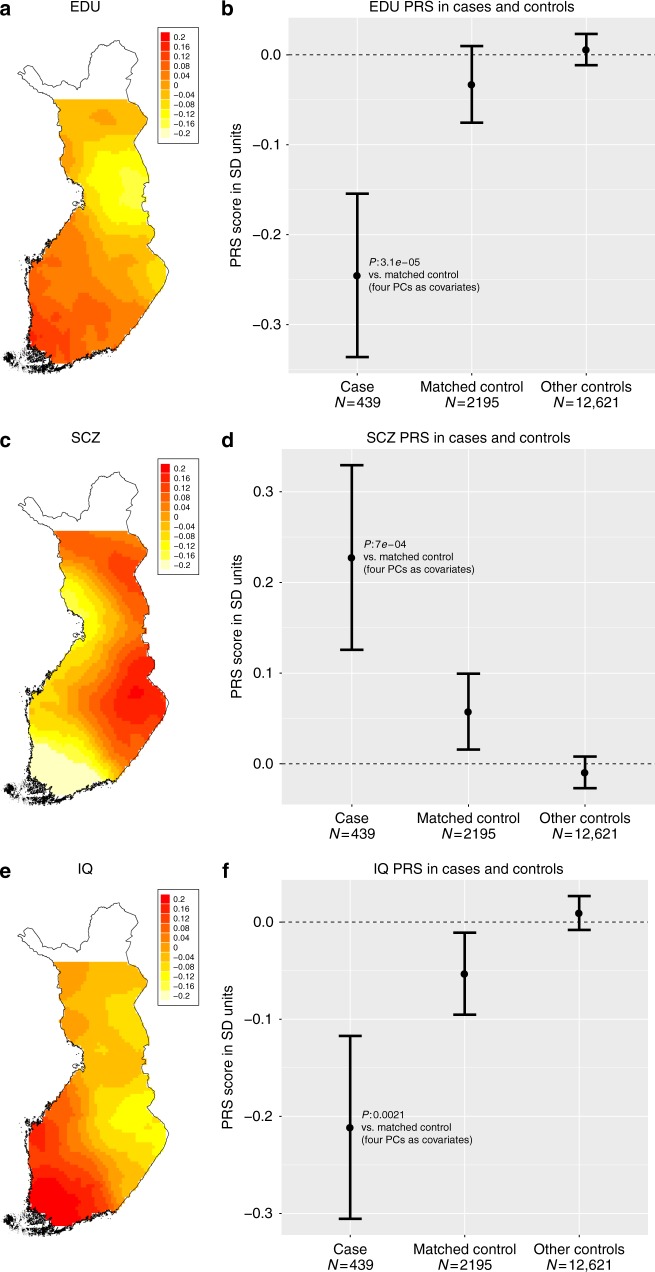
The contribution of de novo variants in severe intellectual disability (ID) has been extensively studied whereas the genetics of mild ID has been less characterized. To elucidate the genetics of milder ID we studied 442 ID patients enriched for mild ID (>50%) from a population isolate of Finland. Using exome sequencing, we show that rare damaging variants in known ID genes are observed significantly more often in severe (27%) than in mild ID (13%) patients. We further observe a significant enrichment of functional variants in genes not yet associated with ID (OR: 2.1). We show that a common variant polygenic risk significantly contributes to ID. The heritability explained by polygenic risk score is the highest for educational attainment (EDU) in mild ID (2.2%) but lower for more severe ID (0.6%). Finally, we identify a Finland enriched homozygote variant in the CRADD ID associated gene.


Conflict of interest statement

The authors declare no competing interests.

Figures

Fig. 1
Fig. 1
ID prevalence estimates in different municipalities in Finland. The primary NFID collection municipalities of Northern Ostrobothnia, Kainuu and Lapland are outlined in solid black. The approximate boundary between early and late settlements is shown with a dashed line
Fig. 2
Fig. 2
Enrichment of likely pathogenic and synonymous variants in known ID genes. Enrichment of variants in 818 known ID genes (Methods) in NFID cases compared to genetically matched controls. Heterozygotes were counted only for those genes for which a dominant inheritance mode is reported. The number of carriers and total individuals are given on the left and in parenthesis the proportion of carriers. Circles indicate the odds ratio (OR) and lines indicate 95% confidence interval of the OR. The synonymous variant identification comparison was performed to assess if possible differences in the variant identification rate due to batch/capture differences were adequately controlled. PTV protein truncating variant, CADD Combined Annotation-Dependent Depletion pathogenicity score, pLI probability of loss of function intolerance. Source data are provided as a Source Data file
Fig. 3
Fig. 3
Enrichment of rare variants in genes not previously associated with NDDs. Variants not observed in GnomAD or Finnish controls in novel ID genes in cases compared to genetically matched controls (see Methods). Rate in each variant category is first estimated for all novel genes and then after subsetting to only novel high pLI genes. All missense variants are predicted to be deleterious (MPC > 2, see Methods). On the left the number of carriers and total individuals are given and in parenthesis the proportion of carriers. Circles indicate the odds ratio (OR) and lines indicate the 95% confidence interval of the OR. The synonymous variant identification comparison was performed to assess if possible differences in the variant identification rate due to batches/capture differences were adequately controlled. PTV protein truncating variant, CADD Combined Annotation-Dependent Depletion pathogenicity score, pLI probability of loss of function intolerance. Source data are provided as a Source Data file
Fig. 4
Fig. 4
Distribution of different deletion categories. a Deletion categories in ID patients showed enrichment for deletions (>100 kb) in general, and specifically in deletions covering syndrome regions (as defined by the DECIPHER database), deletions that are located in an ID-associated gene region (see above) or CNVs deleting a gene intolerant of protein truncating mutations (pLI > 0.95). b Size distribution of Deletions by size bins, showing enrichment at all sizes > 500 kb . c Size distribution of Duplications by size bins > 500 kb, showing an enrichment for sizes > 1 Mb. Source data are provided as a Source Data file
Fig. 5
Fig. 5
Comparison of the total rate of different classes of variants. Comparison was performed in cases vs. genetically matched controls and in mild vs. more severe ID individuals for which both exome and CNV data was available. On the left the number of carriers and total individuals are given and in parenthesis the proportion of carriers. Circles indicate odds ratio and lines indicate 95% confidence intervals of the odds ratio estimate. a Total genetic diagnostic rate. b Variant classes in “Likely pathogenic” variant categories. c Comparison of the rate of identifying different classes of variants in mild vs. severe (moderate and profound ID combined) patients. d Comparison of the rate of variant types in “Likely pathogenic” category between mild and more severe forms of ID (moderate, severe and profound ID combined). Constrained missense (MPC > 2) variants were analyzed in all genes instead of only high pLI genes in C and D as MPC score incorporates regional missense constraint. Source data are provided as a Source Data file
Fig. 6
Fig. 6
Regional distributions of PRSs within Finland and between cases and contols. a Locally weighted educational attainment PRS distribution in Finnish population controls whose parents birthplace is within 100 km of each other. b Educational attainment PRS in cases and all population controls and genetically matched population controls. c Locally weighted schizophrenia PRS distribution in Finnish population controls whose parents birthplace is within 100 km of each other. d Schizophrenia PRS in cases and all population controls and genetically matched population controls. e Locally weighted IQ PRS distribution in Finnish population controls whose parents birthplace is within 100 km of each other. f IQ PRS in cases and all population controls and genetically matched population controls. Error bars indicate 95% confidence intervals around mean. Y-axis is in SD units of PRS standardized to all population controls. Source data are provided as a Source Data file
Fig. 7
Fig. 7
Estimate of heritability explained by different variant categories on liability scale. a Variance explained by genetic categories in all ID cases. b Variance explained delineated by ID severity. Variance explained was estimated by Nagelkerke r2 while controlling for the first four PCs. 95% Confidence intervals of variance explained were estimated by 5000 bootstrap samples. Source data are provided as a Source Data file

Similar articles

Cited by

References

    1. American Psychiatric Association. DSM 5. Am. J. Psychiatry (2013). 10.1176/appi.books.9780890425596.744053
    1. Ropers HH. Genetics of early onset cognitive impairment. Annu. Rev. Genom. Hum. Genet. 2010;11:161–187. doi: 10.1146/annurev-genom-082509-141640. - DOI - PubMed
    1. Vissers LELM, Gilissen C, Veltman JA. Genetic studies in intellectual disability and related disorders. Nat. Rev. Genet. 2016;17:9–18. doi: 10.1038/nrg3999. - DOI - PubMed
    1. McRae JF, et al. Prevalence and architecture of de novo mutations in developmental disorders. Nature. 2017;542:433–438. doi: 10.1038/nature21062. - DOI - PMC - PubMed
    1. Reichenberg A, et al. Discontinuity in the genetic and environmental causes of the intellectual disability spectrum. Proc. Natl Acad. Sci. USA. 2016;113:1098–1103. doi: 10.1073/pnas.1508093112. - DOI - PMC - PubMed

Publication types

MeSH terms

Substances