. 2019 Jan 24;10(1):412.
doi: 10.1038/s41467-019-08311-0.

A child with perinatal HIV infection and long-term sustained virological control following antiretroviral treatment cessation

Affiliations

A child with perinatal HIV infection and long-term sustained virological control following antiretroviral treatment cessation

Avy Violari et al. Nat Commun. .

Abstract

Understanding HIV remission in rare individuals who initiated antiretroviral therapy (ART) soon after infection and then discontinued, may inform HIV cure interventions. Here we describe features of virus and host of a perinatally HIV-1 infected child with long-term sustained virological control. The child received early limited ART in the Children with HIV Early antiRetroviral therapy (CHER) trial. At age 9.5 years, diagnostic tests for HIV are negative and the child has characteristics similar to uninfected children that include a high CD4:CD8 ratio, low T cell activation and low CCR5 expression. Virus persistence (HIV-1 DNA and plasma RNA) is confirmed with sensitive methods, but replication-competent virus is not detected. The child has weak HIV-specific antibody and T cell responses. Furthermore, we determine his HLA and KIR genotypes. This case aids in understanding post-treatment control and may help design of future intervention strategies.


Conflict of interest statement

The authors declare no competing interests.

Figures
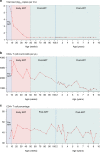
Fig. 1
Fig. 1
Longitudinal viral loads and CD4+ T cell counts. ac Viral load (log10 RNA copies per mL) (a), absolute CD4+ T cell count (cells per µL) (b) and CD4+ T cell percentage (c) are shown over time up to age 9.5 years (open circles joined by red dotted lines). Pre-ART, early ART and post-ART periods are indicated (shaded in lavender, pink, pale green, respectively). The X-axis shows age in weeks and then in years, separated by a blue vertical dotted line. Note: the detection limit of the VL assays used was 400 RNA copies per mL at 10.71 and 116.71 weeks; 50 RNA copies per mL at 33.71 weeks and 20 RNA copies per mL at all other time points. ART antiretroviral therapy
Fig. 2
Fig. 2
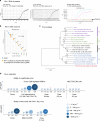
Detection of HIV RNA, HIV DNA and replication-competent virus. a Viral load results at 9.5 years of age when testing the standard 1 mL of plasma (target not detected (TND); left) vs. 10 mL (middle) by the standard Roche assay. A qualitative ultrasensitive RNA nested integrase PCR (IN-qPCR) assay conducted on 3 mL plasma; DNAse treated to ensure no contaminating cell-associated HIV-1 DNA (right). b Quantitation of the total HIV-1 DNA reservoir using a semi-nested quantitative reverse transcription PCR (RT-qPCR) assay at 9.5 years. The standard curve (orange squares) shows plasmid copy number controls (1–100,000 copies) on the x-axis and corresponding cycle threshold values on the y-axis. The case replicates are shown as blue squares. Curves lower than the 100 (1 copy) plasmid control are counted as 1 copy. c A neighbour-joining phylogenetic tree constructed using the partial gag-PR sequence (1414 bp HXB2 nt 903–2334; Gag aa39-501, PR aa 1–28). Reference subtypes A–D (in blue, black, purple and green, respectively) are included and the tree is rooted on SIV chimpanzee sequence (Los Alamos HIV sequence database; https://www.hiv.lanl.gov). Accession numbers (e.g. AF067155) of reference sequences are indicated in the figure. Numbers at the nodes indicate percentage bootstrap scores (n = 1000). The child’s (Case) gag consensus sequence (see Supplementary Fig. 1) is indicated and clusters with subtype C sequences (purple). d The ability to reactivate virus from the child’s CD4+ T cells was measured using two co-culture methods: donor CD8-depleted peripheral blood mononuclear cells (PBMCs) and MOLT4/CCR5 cells (top of panel). Included is the healthy HIV-1-uninfected donor (negative control) and an HIV-1-infected patient with high viral load, CD4+ T cell count <200 cells per µL (positive control). The ability to infect CD4+ cells from the case with HIV-1 BaL (bottom of panel). Donor and MOLT4/CCR5 cells were included as positive controls. The case was tested at the indicated times (age). The different sizes and shades of blue colour of the circles represent the p24 concentration in culture supernatants; the actual pg mL−1 values appear within the circles (the colour key shows ranges of levels of p24 according to shade of blue, with p24 levels increasing with increasing intensity of colour). *Indicates the time point at which a very weak signal was obtained by ultrasensitive nested RNA IN-qPCR assay in the 50-week sample
Fig. 3
Fig. 3
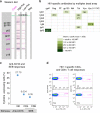
HIV-specific responses and immune response capability of the case at 9.5 years of age. a Detection of HIV-specific antibodies at 9.5 years of age by western blot. The case antibody profile is compared with controls that are a high positive, low positive and HIV-negative. HIV proteins corresponding to bands in the blots are shown in the left grey-shaded block; the case profile was positive for the core proteins indicated in pink. b Quantitation of HIV-specific antibodies by multiplex bead array for all isotypes and subclasses (indicated on the left side—IgG1, IgG2, IgG3, IgG4, IgM, IgA1, IgA2) against gp41, Gag, RT, gp120, Nef, Tat, Vpu, peptide Vpu9 and V1V2 scaffold antigens (indicated at the top). Results are expressed as mean fluorescence intensities (MFI)), the colour key shows ranges of MFI according to colour intensity (the darker the more HIV-specific antibody detected). A result is considered positive if above the cut-off (mean ± 3 SD) determined from eight adult uninfected controls. Vpu9 amino acid sequence: STMVDMGHLRLLDVNDL. c Proportions of natural killer (NK) cells that respond to anti-CD16 antibody, and CD4+ and CD8+ T cells that respond to staphylococcal enterotoxin B (SEB) in a whole blood intracellular cytokine (ICC) assay that measures induction of interferon-γ (IFN-γ) and interleukin-2 (IL-2). HIV-uninfected adult reference values for comparison (n = 21; median % and range)—natural killer (NK) anti-CD16%: 37.92 (12–67.6), CD4 SEB%: 6.04 (0.25–11.91), CD8 SEB%: 5.82 (0.18–18.94). d A weak positive CD4+ T cell response to Gag (0.116%) in the absence of a detectable CD8+ T cell response to Gag (<0.1%; 0.023%). UN: addition of costimulatory antibodies anti-CD28 and anti-CD49d, no stimulation with peptides
Fig. 4
Fig. 4
HLA class I and II alleles and KIR genotype. a HLA class I A, B and C with corresponding allotype designations (non-Bw4, Bw6, Bw4-80TA, C1 and C2), and HLA class II DPB1, DQB1 and DRB1 alleles are indicated as allele 1 and 2. HLA B*44:03:01 has a threonine (T) at position 80 as part of the Bw4 epitope (NLRTALR) of the α1 helix 2 of the molecule—and therefore will bind to KIR3DL1 on NK cells. HLA- Cw*07:01:01 (allotype C1) and Cw*04:01:01 (C2) have a lysine (K) and asparagine (N) at position 80, respectively—allowing for interaction with both KIR2DL3 (C1) and 2DL1 (C2) on NK cells. b The presence (coloured box) or absence of 16 KIR genes (14 functional and 2 pseudogenes 2DP1 and 3DP1) is shown. The child has an AA1 genotype, which has 9 KIR genes, has 2 copies of KIR3DL1 and 2 copies of activating gene KIR2DS4 with one full-length (f) and one truncated (v) version (heterozygous f/v). 2D: 2-domain; 3D: 3-domain; L: long tail, inhibitory; S: short tail, activating
Fig. 5
Fig. 5
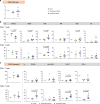
Immunophenotyping of CD4+ and CD8+ T cells. ac Cell parameters determined by flow cytometry for the child at 9.5 years are compared with those of uninfected age-matched children (n = 5) and uninfected adults (n = 10): a CD4:CD8 ratio. b Percentages of CD4+ and CD8+ T cell subsets according to stage of differentiation. Naive (CD45RO−CCR7+CD62L+CD95−); SCM: stem cell memory (CD45RO−CCR7+CD62L+CD95+); CM: central memory (CD45RO+CCR7+CD62L+CD95+); TM: transitional memory (CD45RO+CCR7−CD62L+CD95+), EM: effector memory (CD45RO+CCR7−CD62L−CD95+); TE: terminal effector (CD45RO−CCR7−CD62L−CD95+). c CCR5 density and percentages of cells expressing CCR5, HLA-DR (immune activation), TIGIT and PD-1 (immune checkpoint inhibitory molecules) on CD4+ and CD8+ T cells. Uninfected children were compared to adults using two-tailed non-parametric Mann–Whitney U tests; individual data points are shown as coloured circles; medians are shown as solid lines; statistical significance at P < 0.05 is indicated. One adult outlier (extreme) data point was omitted from the CD8+HLA-DR+ graph; the adult vs. children comparison was not statistically different with or without this data point (P > 0.05)

Similar articles

Cited by

References

    1. Finzi D, et al. Identification of a reservoir for HIV-1 in patients on highly active antiretroviral therapy. Science. 1997;278:1295–1300. doi: 10.1126/science.278.5341.1295. - DOI - PubMed
    1. Wong JK, et al. Recovery of replication-competent HIV despite prolonged suppression of plasma viremia. Science. 1997;278:1291–1295. doi: 10.1126/science.278.5341.1291. - DOI - PubMed
    1. Chun TW, et al. Early establishment of a pool of latently infected, resting CD4(+) T cells during primary HIV-1 infection. Proc. Natl Acad. Sci. USA. 1998;95:8869–8873. doi: 10.1073/pnas.95.15.8869. - DOI - PMC - PubMed
    1. Ananworanich J, et al. HIV DNA set point is rapidly established in acute HIV infection and dramatically reduced by early ART. EBioMedicine. 2016;11:68–72. doi: 10.1016/j.ebiom.2016.07.024. - DOI - PMC - PubMed
    1. Colby DJ, et al. Rapid HIV RNA rebound after antiretroviral treatment interruption in persons durably suppressed in Fiebig I acute HIV infection. Nat. Med. 2018;24:923–926. doi: 10.1038/s41591-018-0026-6. - DOI - PMC - PubMed

Publication types

MeSH terms