. 2019 Jan 24;9(1):683.
doi: 10.1038/s41598-018-36361-9.

Collaborative efforts to forecast seasonal influenza in the United States, 2015-2016

Collaborators, Affiliations

Collaborative efforts to forecast seasonal influenza in the United States, 2015-2016

Craig J McGowan et al. Sci Rep. .

Abstract

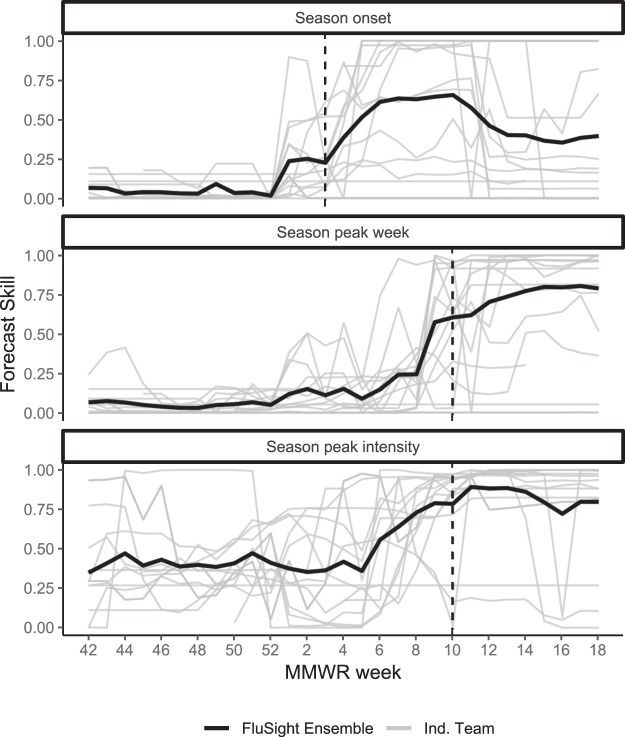
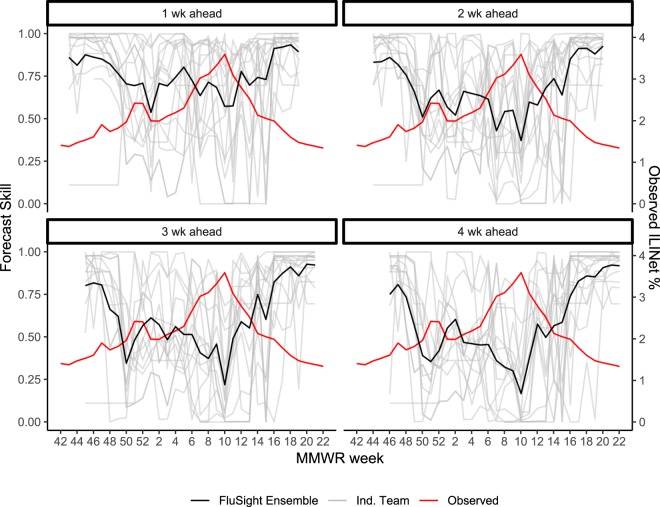
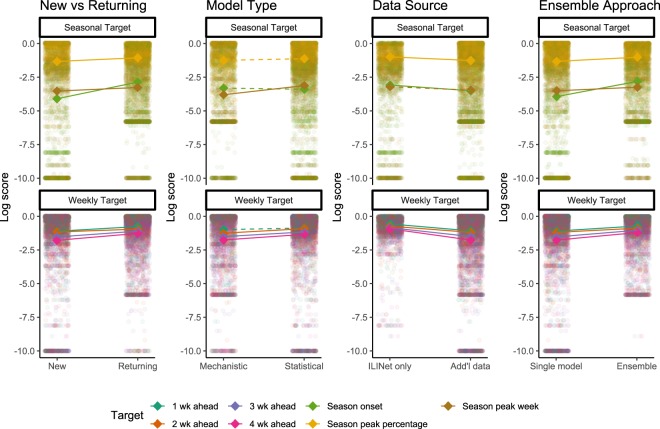
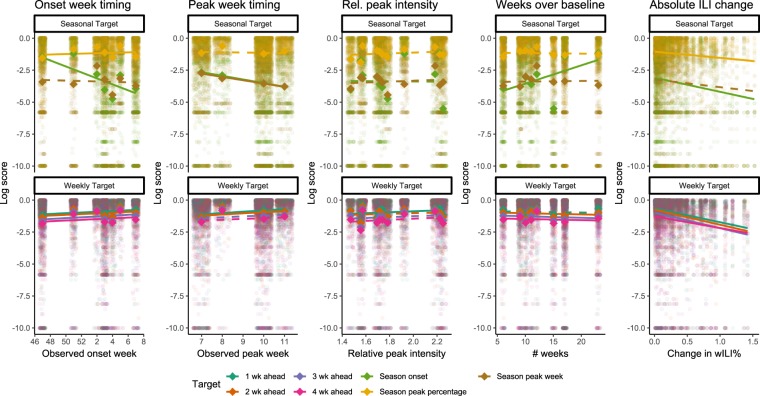
Since 2013, the Centers for Disease Control and Prevention (CDC) has hosted an annual influenza season forecasting challenge. The 2015-2016 challenge consisted of weekly probabilistic forecasts of multiple targets, including fourteen models submitted by eleven teams. Forecast skill was evaluated using a modified logarithmic score. We averaged submitted forecasts into a mean ensemble model and compared them against predictions based on historical trends. Forecast skill was highest for seasonal peak intensity and short-term forecasts, while forecast skill for timing of season onset and peak week was generally low. Higher forecast skill was associated with team participation in previous influenza forecasting challenges and utilization of ensemble forecasting techniques. The mean ensemble consistently performed well and outperformed historical trend predictions. CDC and contributing teams will continue to advance influenza forecasting and work to improve the accuracy and reliability of forecasts to facilitate increased incorporation into public health response efforts.


Conflict of interest statement

J.S. discloses partial ownership of S.K. Analytics, S.K. and H.M. disclose consulting for S.K. Analytics. The remaining authors declare no competing interests.

Figures

Figure 1
Figure 1
Percentage of visits for ILI reported by ILINet – 2009–2010 season to 2015–2016 season.
Figure 2
Figure 2
Weekly forecast skill for national onset week, season peak intensity, and season peak week during the 2015–2016 influenza season. Each grey line represents a separate forecast model, the solid black line represents the FluSight Ensemble, and vertical dashed lines indicate the date when the forecasted target occurred.
Figure 3
Figure 3
Weekly forecast skill for one to four week ahead forecasts of the national ILINet percentage for individual team forecasts shown in grey and for the FluSight Ensemble shown in black during the 2015–2016 season, by week, with the observed ILINet percent (wILI%) overlaid in red. The x-axis represents the MMWR week that each forecast is predicting.
Figure 4
Figure 4
Log scores by characteristics of the forecasting approach. Each small, transparent point represents the log score for a specific target (colours), location, and forecast week. Seasonal targets are shown in the top panel and short-term targets in the bottom panel. Each sub-panel is divided by forecast characteristics including whether the team had participated in previous seasons, whether the model was mechanistic or statistical, whether data sources other than ILINet were used, and whether an ensemble was used to create the forecast. Bold diamonds represent the average log score across models for each target in each category. Solid lines indicate statistically significant differences determined by multivariable gamma regression controlling for location and forecast week.
Figure 5
Figure 5
Log scores by characteristics of the influenza season. Each small, transparent point represents the log score for a specific target (colours), location, and forecast week. Seasonal targets are shown in the top panel and short-term targets in the bottom panel. Each sub-panel is divided by seasonal characteristics including observed timing of onset week, observed timing of peak week, relative intensity of the peak wILI% value to the baseline value, the number of weeks ILINet remained above baseline, and the absolute difference between the initial published wILI% value for the week a forecast is based on and the week’s final wILI% value. Bold diamonds represent the average log score across models for each target in each category. Solid lines indicate statistically significant differences determined by multivariable gamma regression controlling for forecast week.

Similar articles

Cited by

References

    1. Centers for Disease Control and Prevention. Estimated Influenza Illnesses and Hospitalizations Averted by Vaccination — United States, 2013–14 Influenza Season, https://www.cdc.gov/flu/about/disease/2014-15.htm (2015).
    1. Molinari NA, et al. The annual impact of seasonal influenza in the US: measuring disease burden and costs. Vaccine. 2007;25:5086–5096. doi: 10.1016/j.vaccine.2007.03.046. - DOI - PubMed
    1. Appiah GD, et al. Influenza activity - United States, 2014-15 season and composition of the 2015-16 influenza vaccine. MMWR. Morbidity and mortality weekly report. 2015;64:583–590. - PMC - PubMed
    1. Davlin SL, et al. Influenza Activity - United States, 2015-16 Season and Composition of the 2016-17 Influenza Vaccine. MMWR. Morbidity and mortality weekly report. 2016;65:567–575. doi: 10.15585/mmwr.mm6522a3. - DOI - PubMed
    1. Centers for Disease Control and Prevention. Overview of Influenza Surveillance in the United States, https://www.cdc.gov/flu/weekly/overview.htm (2016).

Publication types