. 2019 Jan 24;9(1):507.
doi: 10.1038/s41598-018-36598-4.

Spatio-temporal overview of neuroinflammation in an experimental mouse stroke model

Affiliations

Spatio-temporal overview of neuroinflammation in an experimental mouse stroke model

Lara Buscemi et al. Sci Rep. .

Abstract

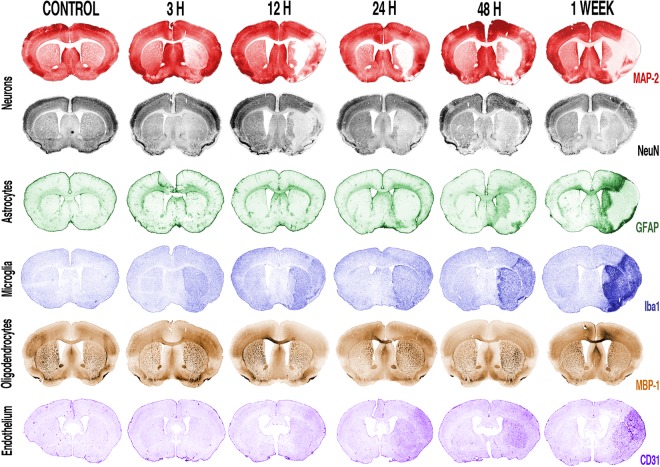
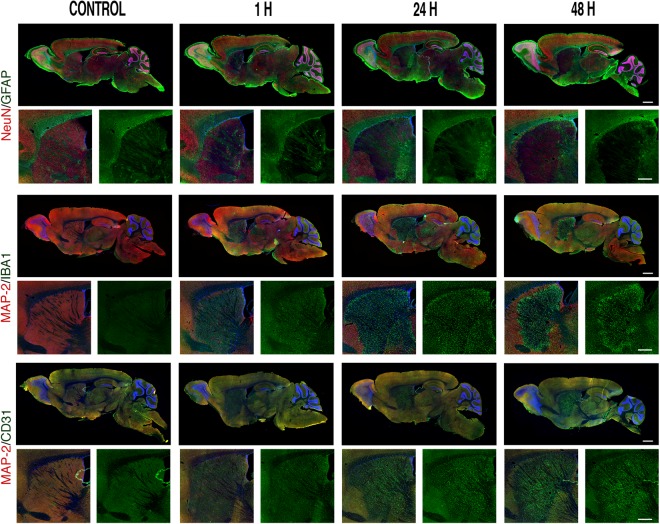
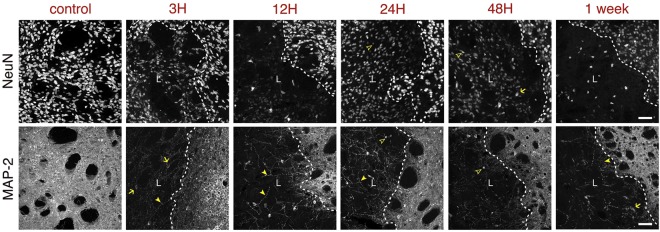
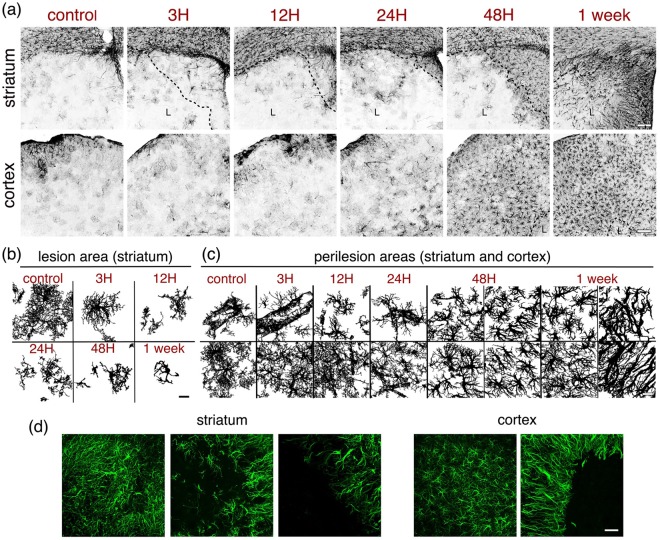
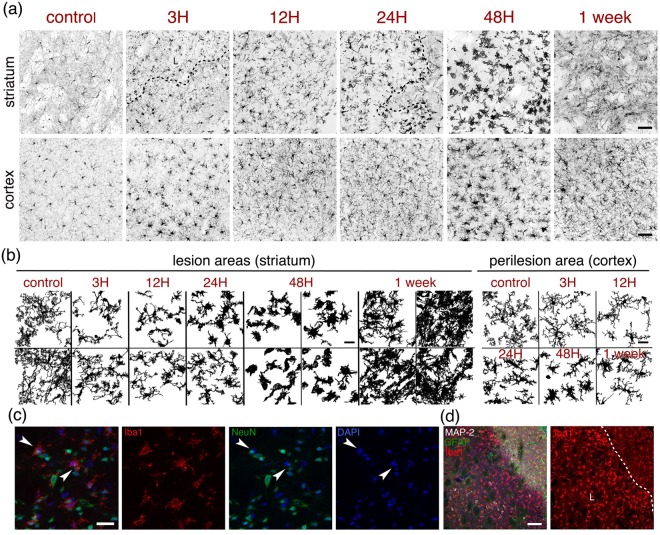
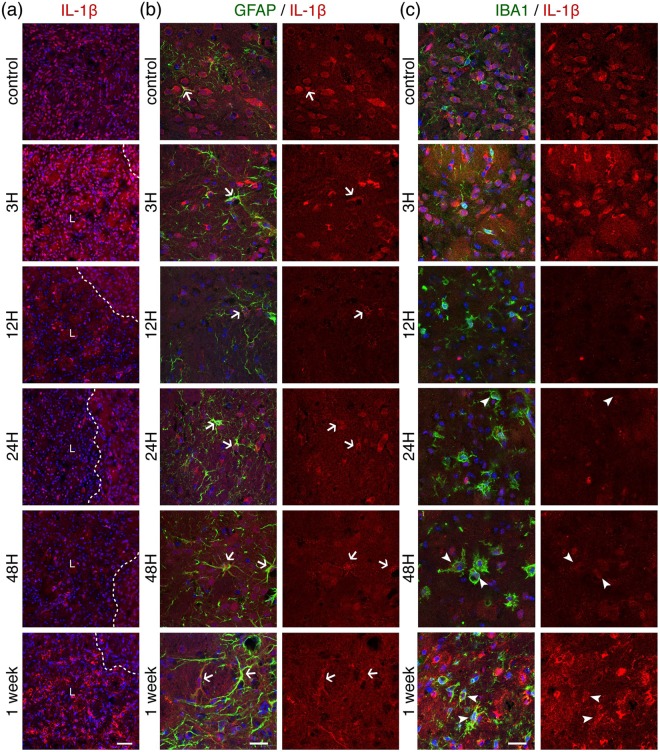
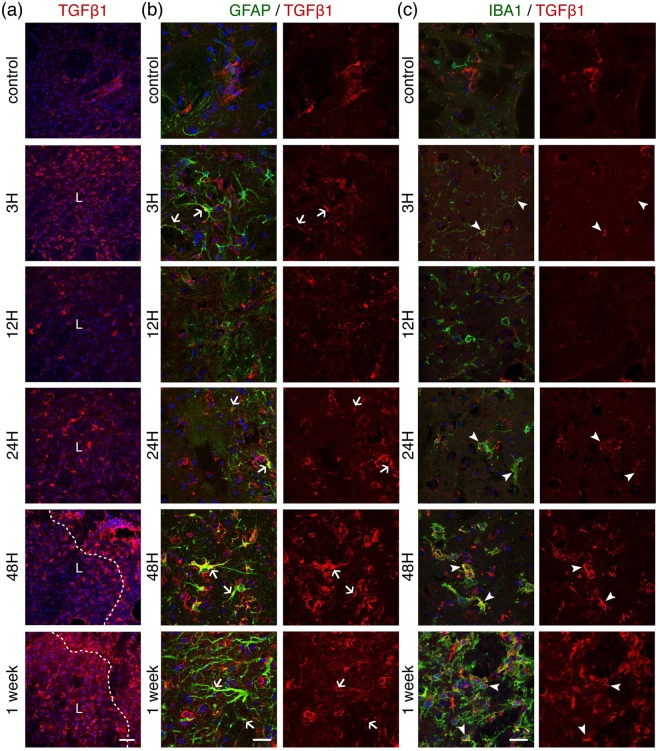
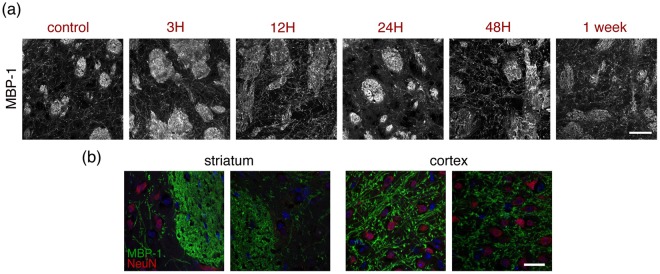
After ischemic stroke, in the lesion core as well as in the ischemic penumbra, evolution of tissue damage and repair is strongly affected by neuroinflammatory events that involve activation of local specialized glial cells, release of inflammatory mediators, recruiting of systemic cells and vascular remodelling. To take advantage of this intricate response in the quest to devise new protective therapeutic strategies we need a better understanding of the territorial and temporal interplay between stroke-triggered inflammatory and cell death-inducing processes in both parenchymal and vascular brain cells. Our goal is to describe structural rearrangements and functional modifications occurring in glial and vascular cells early after an acute ischemic stroke. Low and high scale mapping of the glial activation on brain sections of mice subjected to 30 minutes middle cerebral artery occlusion (MCAO) was correlated with that of the neuronal cell death, with markers for microvascular changes and with markers for pro-inflammatory (IL-1β) and reparative (TGFβ1) cytokines. Our results illustrate a time-course of the neuroinflammatory response starting at early time-points (1 h) and up to one week after MCAO injury in mice, with an accurate spatial distribution of the observed phenomena.


Conflict of interest statement

The authors declare no competing interests.

Figures

Figure 1
Figure 1
Coronal overview of the spatio-temporal evolution of the glial and vascular reaction to 30 minutes transient middle cerebral artery occlusion with reperfusion. Coronal pseudo-coloured images. Neurons were stained with MAP-2 (red) or NeuN (grey), reactive astrocytes were stained with GFAP (green), microglial cells were stained with Iba1 (blue), oligodendrocytes were stained with MBP-1 (dark yellow) and endothelial cells with CD31 (purple) on coronal sections of mouse brain at the time-points indicated above the images. The images shown are representative of at least three animals per time-point.
Figure 2
Figure 2
Sagittal overview of the spatio-temporal evolution of the glial and vascular reaction to 30 minutes transient middle cerebral artery occlusion with reperfusion. Double immunostaining showing the spatio-temporal relation of glial (astrocytes, GFAP staining in green; microglia, Iba1 staining in green) and vascular endothelial cells (CD31 staining in green) with respect to the lesion (loss of NeuN or MAP-2 staining in red) on a sagittal view encompassing a broad array of brain areas. Scale bars: 1 mm. Under each double staining sagittal image there is a higher-resolution cropping of the striatal area showing the temporal evolution for astrocytes (GFAP, green), microglia (Iba1, green) and endothelial cells (CD31, green). Scale bars: (500 μm).
Figure 3
Figure 3
Time-course of neuronal loss after MCAO. (a) Neurons were immunostained with NeuN to illustrate the evolution of the lesion in the ipsilateral striata of mice subjected to 30 minutes MCAO at the time-points indicated above the images. (b) Similarly, neurons were immunostained with a different neuronal marker, MAP-2. A dashed line indicates the boundary of the lesion (L). Arrows indicate swollen cell bodies; arrowheads indicate neurite beading; hollow arrowheads indicate smaller, condensed nuclei. The images shown are representative of at least three animals per time-point. Scale bars: 50 μm.
Figure 4
Figure 4
Reactive astrocytes. (a) Astrocytes from the ipsilateral striatum (top panels) or cortex (bottom panels) of control mice or mice subjected to 30 minutes MCAO were immunostained with GFAP to illustrate the evolution of the astrocytic reaction at the time-points indicated above the images. A dashed line indicates the boundary of the lesion (L). Scale bar: 100 μm. (b,c) Morphological changes of typical astrocytes found within the striatal lesion (b) or in the peri-lesion areas (c) of mice subjected to MCAO are shown using images that were thresholded and subsequently binarized. Scale bars: 20 μm. In 48 h (c) and one-week (c) images, the two left panels correspond to astrocytes in areas distal from the lesion, whereas the two right panels correspond to astrocytes in proximal areas bordering the lesion. (d) Images of the different boundaries between astrocytes (GFAP, green) and damaged tissue taken in striatum (left) and cortex (right). The images shown are representative of at least three animals per time-point. Scale bar: 50 μm.
Figure 5
Figure 5
Microglia. (a) Microglial cells from the ipsilateral striatum (top panels) or cortex (bottom panels) of control mice or mice subjected to 30 minutes MCAO were immunostained with GFAP to illustrate the evolution of the astrocytic reaction at the time-points indicated above the images. A dashed line indicates the boundary of the lesion (L). Scale bars: 50 μm. (b) Morphological changes of typical microglial cells found within the striatal lesion (left) or in the peri-lesion areas (right) of mice subjected to MCAO are shown using images that were thresholded and subsequently binarized. Scale bar: 20 μm. (c) Single plane images of microglial cells stained with Iba1 (red), neurons stained with NeuN (green) and nuclear counterstaining (DAPI, blue) showing engulfment of neurons with condensed nuclei (arrowheads) by microglial cells, 48 h after MCAO onset. Scale bar: 25 μm. (d) Image of the boundary between the penumbral area and the lesion core, defined by the presence or absence of MAP-2 neuronal staining (grey) and delimited by the astrocytic barrier (GFAP staining, green), showing the morphological differences of microglial cells (Iba1 staining, red) on either side of the barrier, with DAPI as nuclear counterstaining, 48 h after MCAO onset. A dashed line indicates the boundary of the lesion (L). The images shown are representative of at least three animals per time-point. Scale bar: 50 μm.
Figure 6
Figure 6
Temporal evolution of the proinflammatory marker Interleukin-1β (IL-1β) after 30 minutes MCAO. (a) Low magnification images from ipsilateral to lesion striatal tissue sections taken at different time-points after ischemia and immunostained for IL-1β (red). A dashed line indicates the boundary of the lesion (L). Scale bar: 50 μm. Sections were counterstained for reactive astrocytes ((b), GFAP staining in green) or microglia ((c), Iba1 staining in green) and shown at higher magnification. Arrows (astrocytes) or arrohweads (microglia) point towards cells that express IL-1β. DAPI (blue) was used as a nuclear counterstaining. The images shown are representative of at least three animals per time-point. Scale bars: 20 μm.
Figure 7
Figure 7
Temporal evolution of the tissue-repair cytokine Transforming Growth Factor β1 (TGFβ1) after 30 minutes MCAO. (a) Low magnification images from ipsilateral to lesion striatal tissue sections taken at different time-points after ischemia and immunostained for TGFβ1 (red). A dashed line indicates the lesion boundary (L). Scale bar: 50 μm. Sections were counterstained for reactive astrocytes ((b), GFAP staining in green) or microglia ((c), Iba1 staining in green) and shown at higher magnification. Arrows (astrocytes) or arrohweads (microglia) point towards cells that express TGFβ1. DAPI (blue) was used as a nuclear counterstaining. The images shown are representative of at least three animals per time-point. Scale bars: 20 μm.
Figure 8
Figure 8
Semi-quantitative evaluation of IL-1β and TGFβ1. Temporal evolution of tissue IL-1β (a) and TGFβ1 (b) levels, normalized to controls. The graphs show the mean and standard deviation of images collected on samples from two (IL-1β) or three (TGFβ1) different sets of experiments. **p < 0.01; ***p < 0.001, one-way ANOVA with Tukey post-hoc test.
Figure 9
Figure 9
Oligodendrocytes. (a) Oligodendrocytes from the ipsilateral striatum of control mice or mice subjected to 30 minutes MCAO were immunostained for Myelin Basic Protein 1 (MBP-1) to illustrate the damage caused to oligodendrocytes at the time-points indicated above the images. Images were taken in the lesion area. Scale bar: 50 μm. (b) Higher magnification, single plane images comparing healthy (left panels) and one-week after stroke (right panels) tissue from striatum or cortex stained for MBP-1 (green) and NeuN (neurons, red) with blue DAPI counterstaining. The images shown are representative of at least two animals per time-point. Scale bar: 20 μm.
Figure 10
Figure 10
Time-course of the vascular remodelling and stromal reaction after MCAO. (a) Endothelial cells (CD31 staining, green) and pericytes and stromal cells (PDGFRβ-1, red) from within the ipsilateral striatum of control mice or mice subjected to 30 minutes MCAO were immunostained to illustrate the evolution of the changes in the vascular system in the lesion as well as the stromal cell reaction at the time-points indicated above the images. Scale bar: 50 μm. (b) Higher magnification images taken at selected time-points and immunostained for CD31 (green) and PDGFRβ-1 (red). DAPI (blue) was used as nuclear counterstaining. Arrows indicate pericytes; arrowheads indicate constriction. Scale bar: 25 μm. (c) Quantification of the volume of CD31-positive cells (left), PDGFRβ-1-positive cells (middle) and the PDGFRβ-1/CD31 volume ratio (right). To avoid interference of the background noise, only images of PDGFRβ-1 from 24 h onwards were considered. The graphs show the mean and standard deviation of images collected on samples from three different sets of experiments. ***p < 0.001; ****p < 0.0001, one-way ANOVA with Tukey post-hoc test. The images shown are representative of at least three animals per time-point. Although the volume of CD31-labelled cells has returned to volumes observed in control mice one week after MCAO, the CD31-labelling intensity remains stronger.

References

    1. Feigin VL, Norrving B, Mensah GA. Global Burden of Stroke. Circulation research. 2017;120:439–448. doi: 10.1161/circresaha.116.308413. - DOI - PubMed
    1. Ahmed N, et al. Implementation and outcome of thrombolysis with alteplase 3-4.5 h after an acute stroke: an updated analysis from SITS-ISTR. The Lancet. Neurology. 2010;9:866–874. doi: 10.1016/s1474-4422(10)70165-4. - DOI - PubMed
    1. Saver JL, et al. Time to Treatment With Endovascular Thrombectomy and Outcomes From Ischemic Stroke: A Meta-analysis. Jama. 2016;316:1279–1288. doi: 10.1001/jama.2016.13647. - DOI - PubMed
    1. Albers, G. W. et al. Thrombectomy for Stroke at 6 to 16 Hours with Selection by Perfusion Imaging. 378, 708–718, 10.1056/NEJMoa1713973 (2018). - PMC - PubMed
    1. Nogueira RG, et al. Thrombectomy 6 to 24 Hours after Stroke with a Mismatch between Deficit and Infarct. New England Journal of Medicine. 2017;378:11–21. doi: 10.1056/NEJMoa1706442. - DOI - PubMed

Publication types

MeSH terms