. 2019 Jan 24;9(1):714.
doi: 10.1038/s41598-018-36566-y.

C/EBPβ regulates Vegf gene expression in granulosa cells undergoing luteinization during ovulation in female rats

Affiliations

C/EBPβ regulates Vegf gene expression in granulosa cells undergoing luteinization during ovulation in female rats

Masahiro Shinagawa et al. Sci Rep. .

Abstract

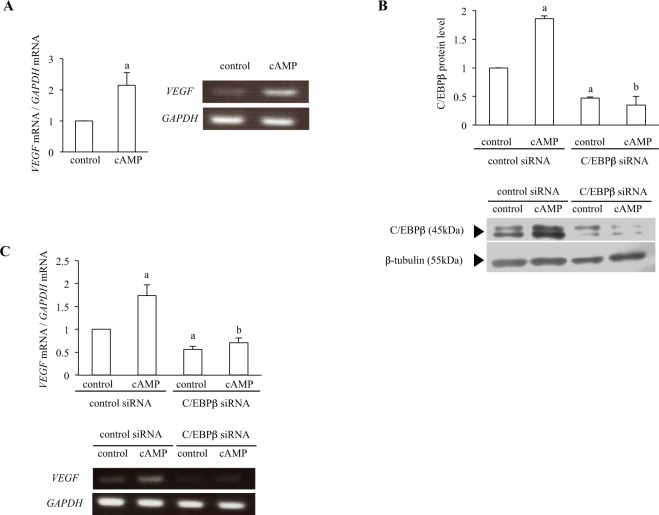
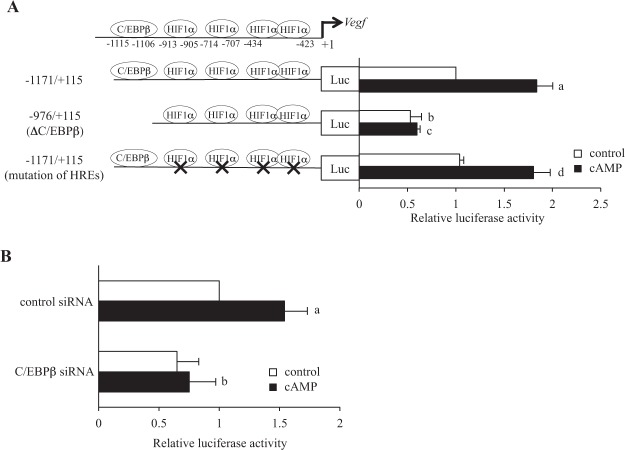
The ovulatory LH-surge increases Vegf gene expression in granulosa cells (GCs) undergoing luteinization during ovulation. To understand the factors involved in this increase, we examined the roles of two transcription factors and epigenetic mechanisms in rat GCs. GCs were obtained from rats treated with eCG before, 4 h, 8 h, 12 h and 24 h after hCG injection. Vegf mRNA levels gradually increased after hCG injection and reached a peak at 12 h. To investigate the mechanism by which Vegf is up-regulated after hCG injection, we focused on C/EBPβ and HIF1α. Their protein expression levels were increased at 12 h. The binding activity of C/EBPβ to the Vegf promoter region increased after hCG injection whereas that of HIF1α did not at this time point. The C/EBPβ binding site had transcriptional activities whereas the HIF1α binding sites did not have transcriptional activities under cAMP stimulation. The levels of H3K9me3 and H3K27me3, which are transcriptional repression markers, decreased in the C/EBPβ binding region after hCG injection. The chromatin structure of this region becomes looser after hCG injection. These results show that C/EBPβ regulates Vegf gene expression with changes in histone modifications and chromatin structure of the promoter region in GCs undergoing luteinization during ovulation.


Conflict of interest statement

The authors declare no competing interests.

Figures

Figure 1
Figure 1
Vegf mRNA expression in rat GCs undergoing luteinization. The relative mRNA levels of Vegf in GCs before (0 h) and 4, 8, 12, 24 h after hCG injection were assessed by qPCR. Gapdh was used as an internal control. Data were shown as a ratio of those of 0 h. Each value represents the mean ± SEM of 6 animals. a, P < 0.05 vs. 0 h. mRNA expression was also assessed by RT-PCR. The images of representative gels are shown.
Figure 2
Figure 2
C/EBPβ and HIF1α protein expressions in rat GCs undergoing luteinization. Whole cell lysate were isolated from the GCs (0 h and 12 h). Protein levels of C/EBPβ (A) and HIF1α (B) were examined by Western blotting. Protein levels of histone H3 were also assessed to ensure equal amount of proteins. Western blotting was repeated 3 times, and the representative immunoblots are shown. Quantification of bands were performed by using ImageJ and normalized with histone H3 levels. Data were shown as a ratio of those of 0 h. Each value represents the mean ± SEM of 3 independent experiments. a, P < 0.05 vs. 0 h.
Figure 3
Figure 3
Binding activities of C/EBPβ and HIF1α to the Vegf promoter region in rat GCs undergoing luteinization. (A) Location of the binding sites for transcription factors. Primers for ChIP assay were designed to surround the C/EBPβ binding site (−1148 bp to −1024 bp) and the HIF1α binding sites (−976 bp to −857 bp; region-1, −724 bp to −645 bp; region-2, −470 bp to −369 bp; region-3). Binding activities of C/EBPβ (B) and HIF1α (C) before (0 h) and 12 h after hCG injection were analyzed by ChIP assay. GCs from three rats were pooled at each time point to use for ChIP assay. ChIP assay was performed with antibodies to C/EBPβ, HIF1α and control IgG. The relative binding activities of C/EBPβ and HIF1α were assessed by qPCR. The ratio of IP DNA to INPUT DNA sample was calculated. Data were shown as a ratio of those of 0 h. Each value represents the mean ± SEM of 3 independent experiments. a, P < 0.05 vs. 0 h. PCR products from IP DNA and INPUT DNA were also electrophoresed. The images of representative gels are shown.
Figure 4
Figure 4
Effect of C/EBPβ knockdown on VEFG mRNA expression. (A) KGN cells were treated with or without cAMP (0.5 mM) for 24 h. The relative mRNA levels of VEGF were assessed by qPCR. GAPDH was used as an internal control. Data were shown as a ratio of the control treatment sample. Each value represents the mean ± SEM of 3 independent incubations. a, P < 0.05 vs. control sample. mRNA expression was also assessed by RT-PCR. The images of representative gels are shown. (B) KGN cells were transfected with a siRNA targeted against C/EBPβ or with a nontargeting siRNA as a control. After 24 h of transfection, cells were treated with or without cAMP for 24 h. Whole cell lysates were prepared and protein levels of C/EBPβ were examined by Western blotting to confirm the C/EBPβ knockdown. Protein levels of β−tubulin were also assessed to ensure equal amount of proteins. Western blotting was repeated 3 times, and the representative immunoblots are shown. Quantification of bands were performed by using ImageJ and normalized with β−tubulin levels. Data were shown as a ratio of the control treatment sample. Each value represents the mean ± SEM of 3 independent experiments. a, P < 0.05 vs. control treatment; b, P < 0.05 vs. cAMP treatment in the control siRNA. (C) The relative mRNA levels of VEGF were assessed by qPCR. GAPDH was used as an internal control. Data were shown as a ratio of the control treatment in the control siRNA. Each value represents the mean ± SEM of 3 independent incubations. a, P < 0.05 vs. control treatment in the control siRNA. b, P < 0.05 vs. cAMP treatment in the control siRNA. mRNA expression was also analyzed by RT-PCR. All PCR products were electrophoresed on the same gel and the ethidium bromide-stained gel is a representative of 3 independent incubations.
Figure 5
Figure 5
Transcriptional activities of the C/EBPβ binding site in rat Vegf promoter region. (A) The reporter constructs, −1171 bp to +115 bp, −976 bp to +115 bp (ΔC/EBPβ) and −1171 bp to +115 bp (mutation of HREs) were transfected into KGN cells. After 24 h of transfection, cells were treated with and without cAMP for 24 h. The firefly luciferase activity was normalized according to Renilla luciferase activities. Values of the luciferase activities were expressed as a ratio of control treatment with −1171 bp to +115 bp. Each value represents the mean ± SEM of 3 independent incubations. a, P < 0.05 vs. control treatment of the construct of −1171 bp to +115 bp. b, P < 0.05 vs. control treatment of the construct of −1171 bp to +115 bp. c, P < 0.05 vs. cAMP treatment of the construct of −1171 bp to +115 bp. d, P < 0.05 vs. control treatment of the construct of −1171 bp to +115 bp (mutation of HREs). (B) The reporter construct of −1171 bp to +115 bp and siRNA (C/EBPβ siRNA or non-targeting siRNA) were transfected into KGN cells. After 24 h of transfection, cells were treated with and without cAMP for 24 h. The firefly luciferase activity was normalized according to Renilla luciferase activities. Values of the luciferase activities were expressed as a ratio of control treatment with −1171 bp to +115 bp. Each value represents the mean ± SEM of 3 independent incubations. a, P < 0.05 vs. control treatment. b, P < 0.05 vs. cAMP treatment in the control siRNA.
Figure 6
Figure 6
Histone modifications, chromatin structure and binding activity of EZH2 to the C/EBPβ binding region in the Vegf promoter in rat GCs undergoing luteinization. GCs were obtained from rats treated with eCG before (0 h) and 12 h after hCG injection. GCs from three rats were pooled at each time point to use for ChIP assay and FAIRE-qPCR. (A) The levels of H3K4me3, H3K9me3 and H3K27me3 of the C/EBPβ binding region were analyzed by ChIP assay. ChIP assay was performed with antibodies to H3K4me3, H3K9me3, H3K27me and control IgG. The relative levels of H3K4me3, H3K9me3 and H3K27me3 were analyzed by real-time PCR. The ratio of IP DNA to INPUT DNA sample was calculated. Data were shown as a ratio of those of 0 h. Each value represents the mean ± SEM of 3 independent experiments. a, P < 0.05 vs. 0 h. All PCR products from IP DNA or INPUT DNA were electrophoresed on the same gel and the representative ethidium bromide-stained gels are shown at the right. (B) To determine the changes of the chromatin structure in the C/EBPβ binding region, a FAIRE-qPCR was performed with same primers used in ChIP assay. The ratio of FAIRE enrichment in the Vegf promoter region was calculated. Data were shown as a ratio of those of 0 h. Each value represents the mean ± SEM of 4 independent experiments. a, P < 0.05 vs. 0 h. (C) Binding activity of EZH2 to the C/EBPβ binding region was analyzed by ChIP assay. ChIP assay was performed with antibodies to EZH2 and control IgG. The relative levels of EZH2 binding activities were analyzed by real-time PCR. The ratio of IP DNA to INPUT DNA sample was calculated. Data were shown as a ratio of those of 0 h. Each value represents the mean ± SEM of 3 independent experiments. a, P < 0.05 vs. 0 h. PCR products from IP DNA and INPUT DNA were also electrophoresed. The images of representative gels are shown.

References

    1. Fraser HM, Duncan WC. SRB Reproduction, Fertility and Development Award Lecture 2008. Regulation and manipulation of angiogenesis in the ovary and endometrium. Reproduction, Fertility and Development. 2009;21:377–392. doi: 10.1071/RD08272. - DOI - PubMed
    1. Sugino N, Matsuoka A, Taniguchi K, Tamura H. Angiogenesis in the human corpus luteum. Reproductive Medicine and Biology. 2008;7:91–103. doi: 10.1111/j.1447-0578.2008.00205.x. - DOI - PMC - PubMed
    1. Kizuka F, et al. Involvement of bone marrow-derived vascular progenitor cells in neovascularization during formation of the corpus luteum in mice. Biol Reprod. 2012;87:55. doi: 10.1095/biolreprod.112.099960. - DOI - PubMed
    1. Ferrara N, et al. Vascular endothelial growth factor is essential for corpus luteum angiogenesis. Nature medicine. 1998;4:336–340. doi: 10.1038/nm0398-336. - DOI - PubMed
    1. Phillips HS, Hains J, Leung DW, Ferrara N. Vascular endothelial growth factor is expressed in rat corpus luteum. Endocrinology. 1990;127:965–967. doi: 10.1210/endo-127-2-965. - DOI - PubMed

Publication types

MeSH terms

Substances