

Stem cell exosomes inhibit angiogenesis and tumor growth of oral squamous cell carcinoma
- PMID: 30679544
- PMCID: PMC6345809
- DOI: 10.1038/s41598-018-36855-6
Stem cell exosomes inhibit angiogenesis and tumor growth of oral squamous cell carcinoma
Abstract
Recently, exosomes secreted by menstrual mesenchymal stem cells have been identified as inhibitory agents of tumor angiogenesis and modulators of the tumor cell secretome in prostate and breast cancer. However, their direct effect on endothelial cells and paracrine mediators have not yet been investigated. Using a carrier-based cell culture system to test the scalability for exosome production, we showed that different types of endothelial cells present specific kinetics for exosomes internalization. Exosome-treatment of endothelial cells increased cytotoxicity and reduced VEGF secretion and angiogenesis in a dose-dependent manner. Using the hamster buccal pouch carcinoma as a preclinical model for human oral squamous cell carcinoma, we demonstrated a significant antitumor effect of intra-tumoral injection of exosomes associated with a loss of tumor vasculature. These results address up-scaling of exosome production, a relevant issue for their clinical application, and also assess menstrual stem cell exosomes as potential anti-angiogenic agents for the treatment of neoplastic conditions.
Conflict of interest statement
MK is the chief science officer of Cells for Cells and Consorcio Regenero. FA-M, PL-G and JC received stipends from Cells for Cells. LR, FL and MIO received stipends from Consorcio Regenero. The other authors declare that they have no competing interests.
Figures
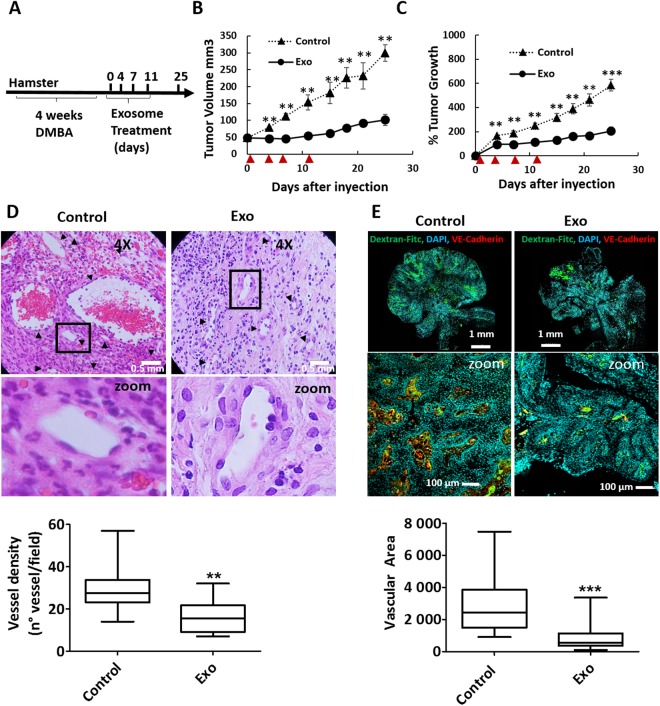
 indicates days of exosome treatment. Control tumors ar e shown as triangles and exosome treated tumors as circles. N = 9 (control), N = 8 (Exo). (D) Histological sections of tumors at day 25 (end-point) with Hematoxylin and eosin stain (H&E). Quantification of vessel density based on H&E sections is shown below. ▲ indicates vessels. (E) Dextran-Fitc (green), VE Cadherin (red) and Hoechst (blue) stained histological sections of tumors at day 25 (end-point). Upper panel: complete tumors, lower panel: zoom of selected tumor area. VE-Cadherin is only shown for zoom (lower panel). Graph shows quantification of vascular area based on dextran stain. Analysis: unpaired t-test. Bar graphs show average values, error bars: SEM.
References
-
- Williams, JK1, Carlson GW, Cohen C, Derose PB, Hunter S, J. M. Tumor angiogenesis as a prognostic factor in oral cavity tumors. Am J Surg. 168, 373–80 (1994). - PubMed
Publication types
MeSH terms
Substances
LinkOut - more resources
Full Text Sources
Other Literature Sources
Medical
