. 2019 Jan 24;9(1):685.
doi: 10.1038/s41598-018-36756-8.

The individual's signature of telomere length distribution

Affiliations

The individual's signature of telomere length distribution

Simon Toupance et al. Sci Rep. .

Abstract

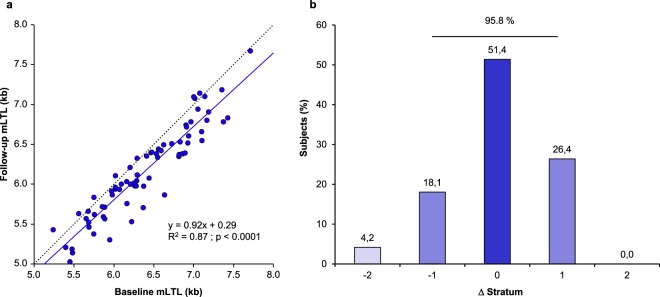
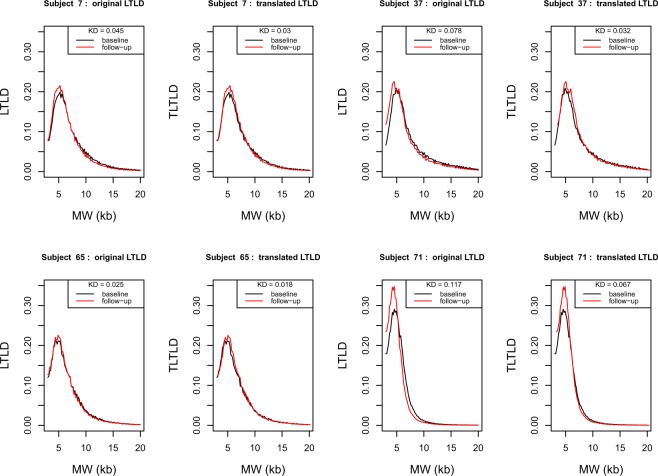
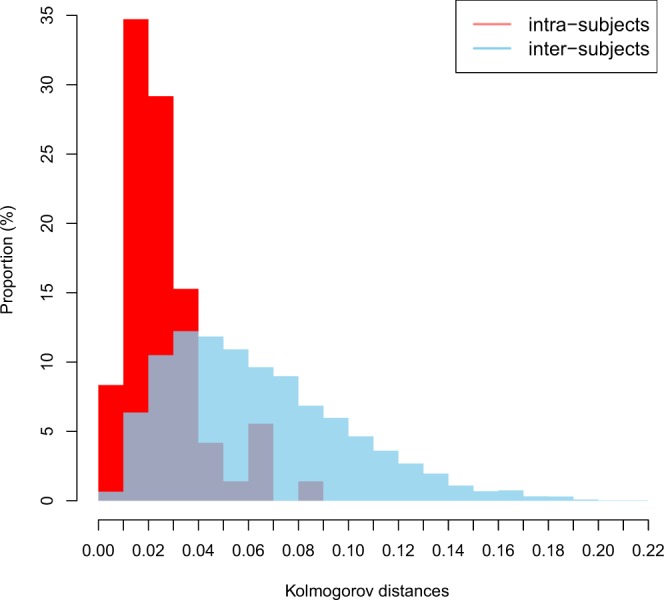
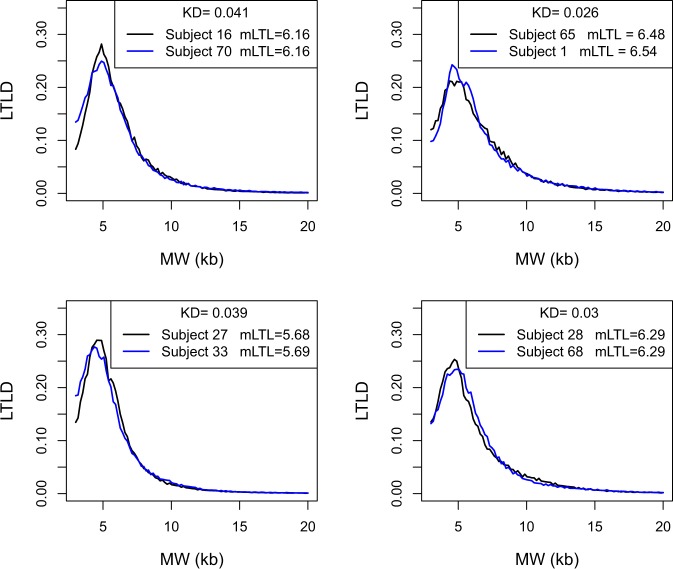
Mean telomere length in human leukocyte DNA samples reflects the different lengths of telomeres at the ends of the 23 chromosomes and in an admixture of cells. However, only rudimentary information is available regarding the distribution of telomere lengths in all chromosomes and the different cell types in leukocyte samples. Understanding the configuration of leukocyte telomere length distribution (LTLD) could be helpful in capturing intrinsic elements that are not provided by the mean leukocyte telomere length (mLTL). The objective of this study was to analyse LTLD and its temporal variation in adults. Leukocyte samples were donated on two occasions (8 years apart) by 72 participants in the ADELAHYDE study. Telomere length was measured by Southern blotting of the terminal restriction fragments. Individuals with comparable mLTLs displayed different shapes of LTLDs. Inter-individual variation in LTLD shape was much larger than intra-individual variation in LTLD shape between baseline and follow-up leukocyte samples. These results show an important individual stability of LTLD shape over time indicating that each individual has a characteristic LTLD signature.


Conflict of interest statement

The authors declare no competing interests.

Figures

Figure 1
Figure 1
Fixed mLTL ranking over time in the ADELAHYDE cohort. (a) Correlation between baseline mLTL and follow-up mLTL. The dashed line represents the identity line. The continuous line represents the linear regression of the data. R2 (based on Pearson correlation) is equal to 0.87. (b) Distribution of subjects exhibiting a change in stratum rank (Δ) between baseline and follow-up examinations (population subdivided in 7 mLTL strata in each examination). A negative sign denotes a downward shift in ranking while a positive sign indicates an upward shift in ranking. mLTL = mean leukocyte telomere length.
Figure 2
Figure 2
Original LTLD and Translated LTLD (TLTLD) of 4 subjects at baseline and follow-up. LTLD = Leukocyte telomere length distribution; TLTLD = Translated leukocyte telomere length distribution; MW = molecular weight; kb = kilobase; KD = Kolmogorov distance Each. pair of panels shows the two LTLDs of one subject at baseline (in black) and follow-up (in red) and their transformation in TLTLD. The Kolmogorov distances between the two LTLD and the two TLTLD are given. The four subjects are respectively subject 7 (upper left panels), 37 (upper right panels), 65 (lower left panels) and 71 (lower right panels).
Figure 3
Figure 3
Intra-subject and inter-subject distribution of Kolmogorov distances between TLTLD. Normalised histograms for intra-subject distances (in red, mean = 0.0258) and inter-subject distances (in blue, mean = 0.0639).
Figure 4
Figure 4
Relationship between LTLD and mLTL. LTLD = Leukocyte telomere length distribution; MW = molecular weight; kb = kilobase; mLTL = mean leukocyte telomere length; KD = Kolmogorov distance. For other abbreviations see legends of Figures 1 and 2. Each panel shows the two LTLD of two subjects with similar mLTL. The Kolmogorov distance between the two LTLD are given.
Figure 5
Figure 5
Distributions of Kolmogorov distances (KD) between pairs of individuals with similar mLTL (inter-subject) and between baseline vs. follow-up visits in all individuals (intra-subject). Normalised histograms for intra-subject distances (in red, mean = 0.0258) and inter-subject (with similar mLTL) distances (in blue, mean = 0.0374). Intra-subject KDs measure the differences in TLTLD between baseline and follow-up of the 72 subjects. Inter-subject KDs measure the differences in LTLD of 86 pairs of subjects with similar mLTL (less than 40 bp difference). For abbreviations see legends of Figures 1 and 2.

References

    1. de Lange T. How telomeres solve the end-protection problem. Science. 2009;326:948–952. doi: 10.1126/science.1170633. - DOI - PMC - PubMed
    1. Harley CB, Futcher AB, Greider CW. Telomeres shorten during ageing of human fibroblasts. Nature. 1990;345:458–460. doi: 10.1038/345458a0. - DOI - PubMed
    1. d’Adda di Fagagna F, et al. A DNA damage checkpoint response in telomere-initiated senescence. Nature. 2003;426:194–198. doi: 10.1038/nature02118. - DOI - PubMed
    1. Youngren K, et al. Synchrony in telomere length of the human fetus. Hum. Genet. 1998;102:640–643. doi: 10.1007/s004390050755. - DOI - PubMed
    1. Haycock PC, et al. Leucocyte telomere length and risk of cardiovascular disease: systematic review and meta-analysis. BMJ. 2014;349:g4227. doi: 10.1136/bmj.g4227. - DOI - PMC - PubMed

Publication types