. 2019 Jan 24;9(1):665.
doi: 10.1038/s41598-018-36878-z.

5-Fluorouracil Induces Enteric Neuron Death and Glial Activation During Intestinal Mucositis via a S100B-RAGE-NFκB-Dependent Pathway

Affiliations

5-Fluorouracil Induces Enteric Neuron Death and Glial Activation During Intestinal Mucositis via a S100B-RAGE-NFκB-Dependent Pathway

Deiziane V S Costa et al. Sci Rep. .

Abstract

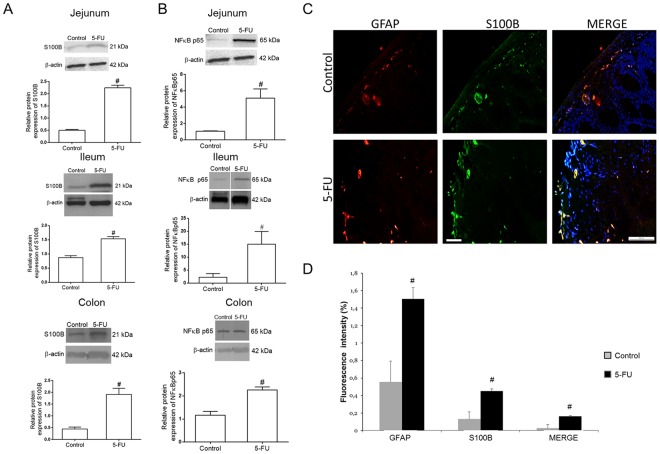
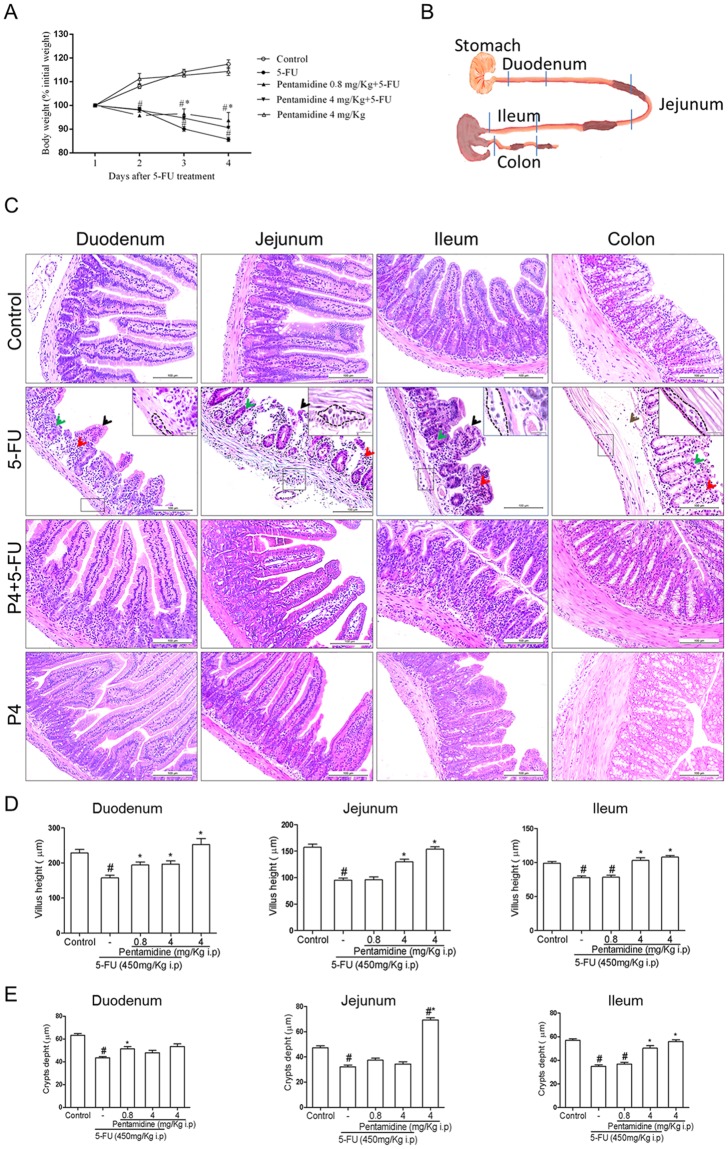
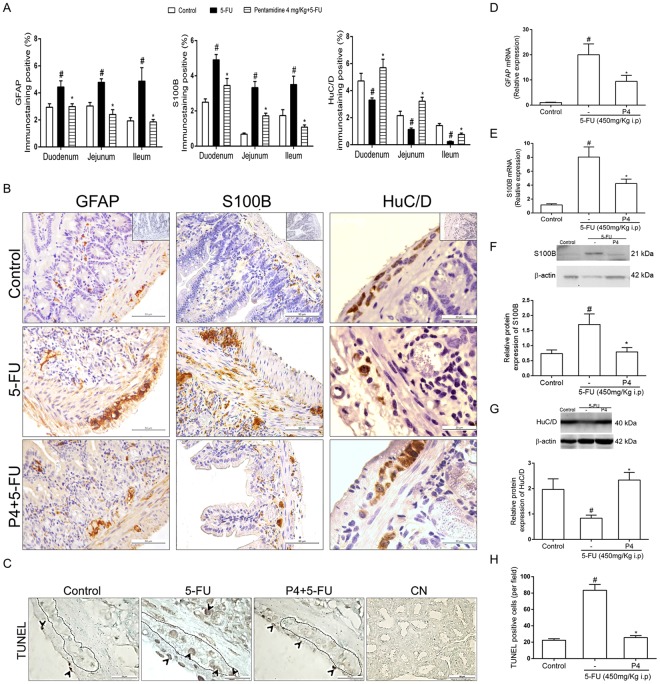
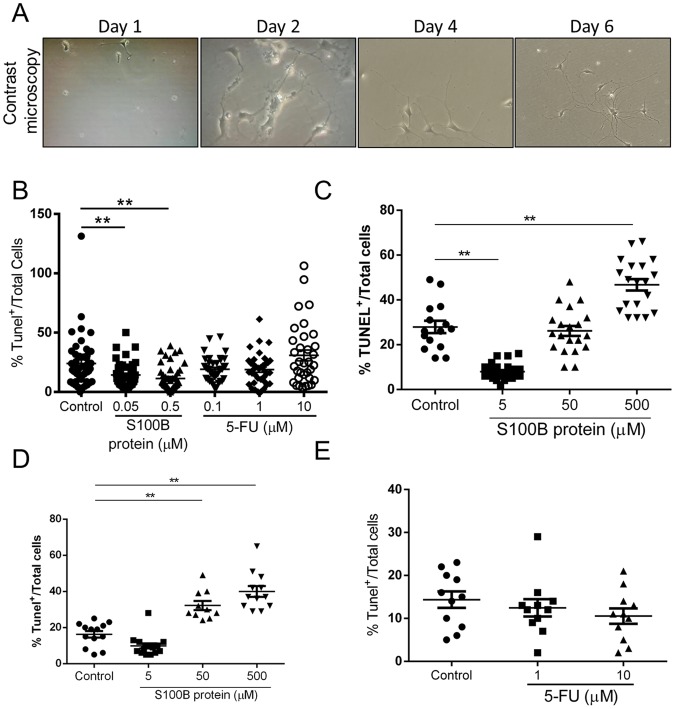
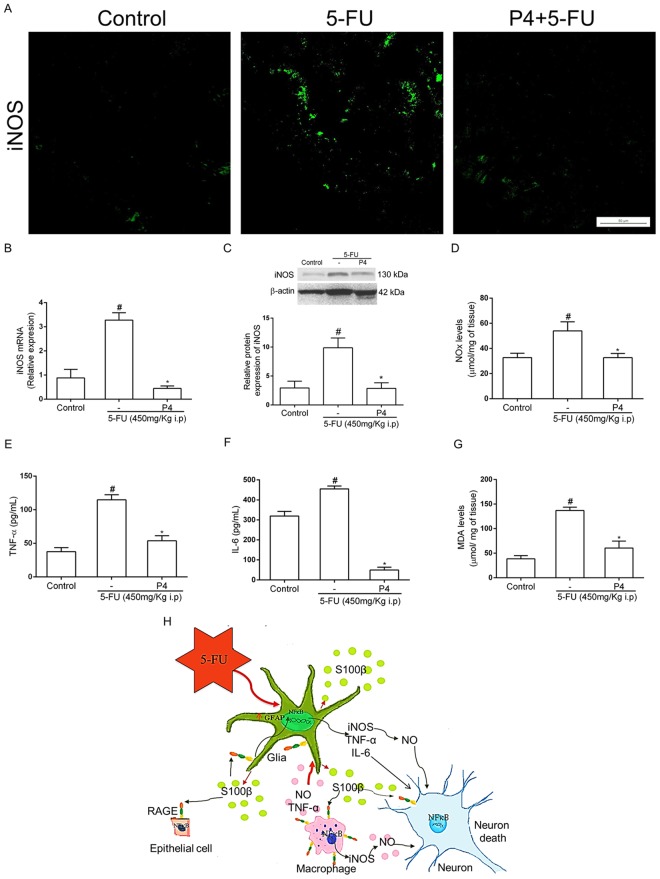
5-Fluorouracil (5-FU) is an anticancer agent whose main side effects include intestinal mucositis associated with intestinal motility alterations maybe due to an effect on the enteric nervous system (ENS), but the underlying mechanism remains unclear. In this report, we used an animal model to investigate the participation of the S100B/RAGE/NFκB pathway in intestinal mucositis and enteric neurotoxicity caused by 5-FU (450 mg/kg, IP, single dose). 5-FU induced intestinal damage observed by shortened villi, loss of crypt architecture and intense inflammatory cell infiltrate as well as increased GFAP and S100B co-expression and decreased HuC/D protein expression in the small intestine. Furthermore, 5-FU increased RAGE and NFκB NLS immunostaining in enteric neurons, associated with a significant increase in the nitrite/nitrate, IL-6 and TNF-α levels, iNOS expression and MDA accumulation in the small intestine. We provide evidence that 5-FU induces reactive gliosis and reduction of enteric neurons in a S100B/RAGE/NFκB-dependent manner, since pentamidine, a S100B inhibitor, prevented 5-FU-induced neuronal loss, enteric glia activation, intestinal inflammation, oxidative stress and histological injury.


Conflict of interest statement

The authors declare no competing interests.

Figures

Figure 1
Figure 1
5-FU upregulates S100B and NFκB p65 protein expression and increases GFAP and S100B co-expression in the intestine. (A) Representative Western Blot images showing S100B and beta-actin (loading control) protein expression. Quantitative analysis indicates that 5-FU increased the expression of S100B in the jejunum, ileum and colon. Bars represent mean ± SEM for 4 tissue samples in each group. #P < 0.01 versus control group, Student’s t test. (B) Representative Western Blot images showing NFκB p65 and beta-actin (loading control) protein expression. Quantitative analysis indicates that 5-FU enhanced NFκB p65 protein expression in the jejunum, ileum and colon. Bars represent mean ± SEM for 4 tissue samples in each group. #P < 0.05 versus control group, Student’s t test. (C) Immunofluorescence images of the colon show GFAP (red) and S100B (green) and their co-localization (Merge, yellow). Nuclei were stained with DAPI. Scale bar, 50 µm. (D) Graph represents the mean ± SEM of the immunofluorescence intensity of GFAP, S100B and their co-localization (GFAP and S100B) in colon tissue from 5 fields per mouse from 4 mice in each group. Intensity of fluorescence were quantified using ImageJ. #P < 0.05 versus control group, Student’s t test.
Figure 2
Figure 2
Effects of S100Β inhibition on 5-FU-induced weight loss and histopathological analysis. (A) Body weight changes are shown as percentages of the baseline value. Bars represent mean ± SEM of eight mice in each group. #P < 0.05 versus control group, *P < 0.05 versus 5-FU group. Two-way ANOVA followed by Bonferroni test. (B) Representative scheme of duodenum, jejunum, ileum and colon segments. (C) 5-FU induces villi shortening (black arrows), loss of crypt architecture (green arrows) and intense inflammatory cell infiltrate (red arrows) in the duodenum, jejunum, ileum and colon, and edema (brown arrows) in the colon submucosal layer. Dotted line and insert indicate the myenteric plexus. H&E; scale bar corresponds to 100 µm in all figures except for inserts (20 µm). (D) Segments of the duodenum, jejunum and ileum were collected for measurement of villus height (10 villi/slide). Bars represent mean ± SEM of 8 mice in each group. #P < 0.01 versus control group, *P < 0.01 versus 5-FU group. (E) Segments of the duodenum, jejunum and ileum were collected for crypt depth measurements (10 crypts/ slide). Bars represent mean ± SEM of 8 mice in each group. #P < 0.01 versus control group, *P < 0.01 versus 5-FU group. One-way ANOVA followed by Bonferroni.
Figure 3
Figure 3
S100B inhibition attenuates 5-FU-induced GFAP and S100B upregulation, reduction of HuC/D expression and cell death in the small intestine. (A) Graphs represent the mean ± SEM of the percentage of GFAP, S100B or HuC/D immunopositive area in the small intestine (duodenum, jejunum and ileum) related to total tissue in 5 (GFAP and S100B) or 10 (HuC/D) microscope fields per mouse from 4 mice in each group, quantified using Photoshop. #P < 0.01 versus control group, *P < 0.01 versus 5-FU group. (B) Representative images illustrating GFAP, S100B and HuC/D immunostaining in the mucosa, submucosa and myenteric plexuses in the jejunum. Scale bar corresponds to 50 µm (GFAP and S100B) or 20 µm (HuC/D). Negative control of each antibody are located on the left of the upper panels (C) Representative images illustrating TUNEL-positive cells (black arrows) in the intestinal crypts, smooth muscle layer and myenteric plexus. Scale bar corresponds to 20 µm (except the negative control-CN-50 µm). (D) GFAP and (E) S100B mRNA expression in the jejunum were evaluated by qPCR (TaqMan® probe). Bars represent mean ± SEM of 6 mice in each group. #P < 0.01 (GFAP) or #P < 0.01 (S100B) versus control group, *P < 0.01 (GFAP) or #P < 0.01 (S100B) versus 5-FU group. (F) S100B and (G) HuC/D protein expression were evaluated by Western Blot. Bars represent mean ± SEM of 6 mice in each group. #P < 0.01 (S100B) or #P < 0.01 (HuC/D) versus control group, *P < 0.01(S100B) or #P < 0.01 (HuC/D) versus 5-FU group. (H) Graphs represent the mean ± SEM of the number of TUNEL-positive cells per field (10 fields per mouse from 4 mice/group) quantified using ImageJ. #P < 0.01 versus control group, *P < 0.01 versus 5-FU group. One-way ANOVA followed by Bonferroni.
Figure 4
Figure 4
Higher concentration of S100B induces enteric neuronal cell death. (A) Representative images of enteric neurons in vitro in different time points (day 1–6) in contrast microscope. (B) Cells were treated on day 0 with S100B (0.05 µM or 0.5 µM) and 5-FU (0.1 µM, 1 µM or 10 µM) for 24 h. Graph represents the mean ± SEM of the percentage of TUNEL positive cells relative to total cells in eight distinct fields of each well per group from 5 different experiments. (C) Cells were treated on day 0 with S100B (5 µM, 50 µM and 500 µM) for 24 h. (D) Cells were treated on day 4 with S100B (5 µM, 50 µM and 500 µM) for 24 h. (E) Cells were treated on day 4 with 5-FU (1 µM and 10 µM) for 24 h. Graph represents the mean ± SEM of the percentage of TUNEL positive cells relative to total cells in three distinct fields of each well per group from 2 different experiments. All images were analysed using ImageJ software. **P < 0.01. One-way ANOVA followed by Bonferroni.
Figure 5
Figure 5
S100B inhibitor decreases 5-FU-induced expression of RAGE and NFκB NLS in enteric neurons and RAGE and NFκB p65 protein expression in the jejunum. (A) Jejunal immunofluorescence images demonstrate HuC/D (red) and RAGE (green) expression and their co-localization (Merge, yellow). Nuclei were stained with DAPI. Scale bar, 50 µm. (B) RAGE protein expression was evaluated by Western Blot. Bars represent mean ± SEM for 6 tissue samples in each group. #P < 0.01 versus control group, *P < 0.01 versus 5-FU group. (C) Immunofluorescence images from the jejunum represent HuC/D (red) and NFκB NLS (green) and their co-localization (Merge, yellow). Nuclei were stained with DAPI. Scale bar, 50 µm. (D) NFκB p65 protein expression was evaluated by Western Blot. Bars represent mean ± SEM for 6 tissue samples in each group. #P < 0.01 versus control group, *P < 0.01 versus 5-FU group. One-way ANOVA followed by Bonferroni.
Figure 6
Figure 6
S100B inhibition reduces 5-FU-induced inflammation and oxidative stress. (A) Immunofluorescence images from jejunal sections represent iNOS (green). Scale bar, 50 µm. (B) iNOS mRNA expression in the jejunum was evaluated by qPCR. Bars represent mean ± SEM of 6 mice in each group. #P < 0.01 versus control group, *P < 0.01 versus 5-FU group. (C) iNOS protein expression was evaluated by Western Blot. #P < 0.01 versus control group, *P < 0.01 versus 5-FU group. (D) Nitrite and nitrate levels were evaluated by the Griess method. #P < 0.05 versus control group, *P < 0.05 versus 5-FU group. (E) TNF-α and (F) IL-6 levels were measured by ELISA. (G) MDA levels were evaluated by the TBARS method. Bars represent mean ± SEM of 6 mice in each group. #P < 0.01 versus control group, *P < 0.01 versus 5-FU group. One-way ANOVA followed by Bonferroni. (H) Proposed model of the role of S100B in 5-FU-induced glial cell activation, neuronal loss and intestinal mucositis. 5-FU disrupts the intestinal epithelial barrier leading to EGCs activation by mediators released by macrophages (TNFα, IL-6 and nitric oxide) and bacteria. This process results in increased expression of GFAP and S100B and further release of S100B into the extracellular environment. Additional to that, it also stimulates neuronal death and activates macrophages through the S100B/RAGE/NFκB pathway to release NO, which can also participate in neuronal death.

Similar articles

Cited by

References

    1. Soveri LM, et al. Association of adverse events and survival in colorectal cancer patients treated with adjuvant 5-fluorouracil and leucovorin: Is efficacy an impact of toxicity? Eur J Cancer. 2014;50:2966–2974. doi: 10.1016/j.ejca.2014.08.017. - DOI - PubMed
    1. Bowen JM, Gibson RJ, Keefe DM. Animal models of mucositis: implications for therapy. J Support Oncol. 2011;9:161–168. doi: 10.1016/j.suponc.2011.04.009. - DOI - PubMed
    1. Gao J, et al. Activation of p38-MAPK by CXCL4/CXCR3 axis contributes to p53-dependent intestinal apoptosis initiated by 5-fluorouracil. Cancer Biol Ther. 2014;15:982–991. doi: 10.4161/cbt.29114. - DOI - PMC - PubMed
    1. Soares PM, et al. Inflammatory intestinal damage induced by 5-fluorouracil requires IL-4. Cytokine. 2013;61:46–49. doi: 10.1016/j.cyto.2012.10.003. - DOI - PubMed
    1. Wu Z, et al. Interleukin 1 receptor antagonist reduces lethality and intestinal toxicity of 5-Fluorouracil in a mouse mucositis model. Biomed Pharmacother. 2011;65:339–344. doi: 10.1016/j.biopha.2011.04.013. - DOI - PubMed

Publication types

MeSH terms

Substances